The citizen participation process including presentations, discussions, public hearings, letters and comments has been long and arduous. The issues are complicated and sometimes feelings run high. In such situations, there can be a feeling that citizens have not been heard. This document, “Guide to Zoning Amendments Related to Multifamily Uses and Mixed-Use“, summarizes many of the issues that have been raised and the changes that have been made in the zoning Articles as a result of the citizen participation in the public review process. Citizens have been heard.
Related articles
Welcome to the redesigned Equitable Arlington website! We know that Arlington values openness and diversity, a greener future, and vibrant neighborhoods and downtowns—but our current zoning is holding us back. We’re advocating for change because we recognize that the choices we make on zoning and housing policy are key to living those values. We are committed to strengthening our community through respectful dialogue and by listening to our neighbors. Our aim with this site redesign is to share accurate and relevant information to help inform such conversations.
With this redesigned site we have:
- Answered some of the most common questions that have come up in our conversations with other residents.
- Created a zoning dictionary with explanations of many of the terms that pepper zoning discussions.
- Gathered a list of resources, where you’ll find everything from short explainer videos to detailed research
- Developed a history of zoning timeline that shows how Arlington’s history fits into the larger context of government actions.
If you’re not familiar with us, I hope you’ll take a minute to read our mission and why our work matters. I also hope you’ll scroll through to meet us, see some of our smiling faces, and read in our own words why we do this work. We’re renters and homeowners, long time residents and newcomers to town who come to this work with a variety of viewpoints and lived experiences!
We believe Arlington can be a leader in the greater Boston area by the choices we make to create more equitable housing policy. Our local actions have effects that go beyond our borders. Arlington has recognized our power to make an impact and has been a regional leader on many issues.
We can channel this same energy and our values to make sure Arlington has the vibrant sustainable and equitable future we all want. To succeed, we need engaged residents who understand the issues, who can balance competing interests, and who are willing to do the necessary hard work. Please join us in building a more equitable Arlington!

You may not know who your Town Meeting Members are. You may not even know what precinct you live in. We’re here to help!
What’s My Precinct?
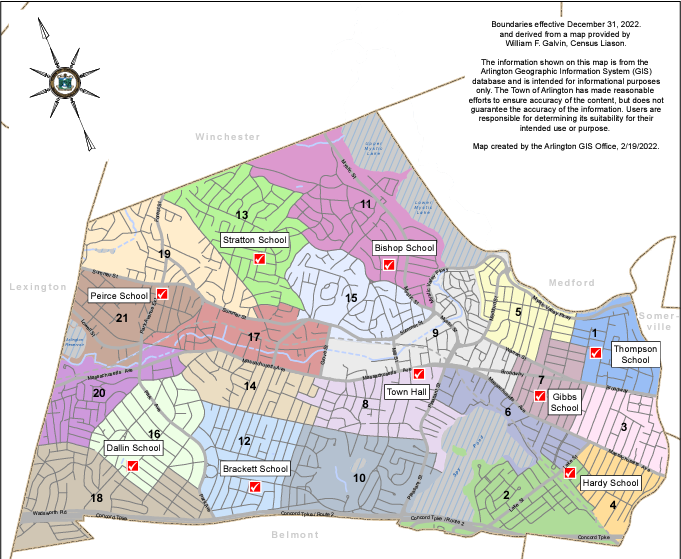
This PDF map of Arlington is divided by precinct. You may need to zoom in to see your precinct.
Who Are My Town Meeting Members?
The town of Arlington has a public list of town meeting members and their contact information. Send them an email telling them how you feel, or ask them if you can take a walk and discuss the MBTA Communities Plan.
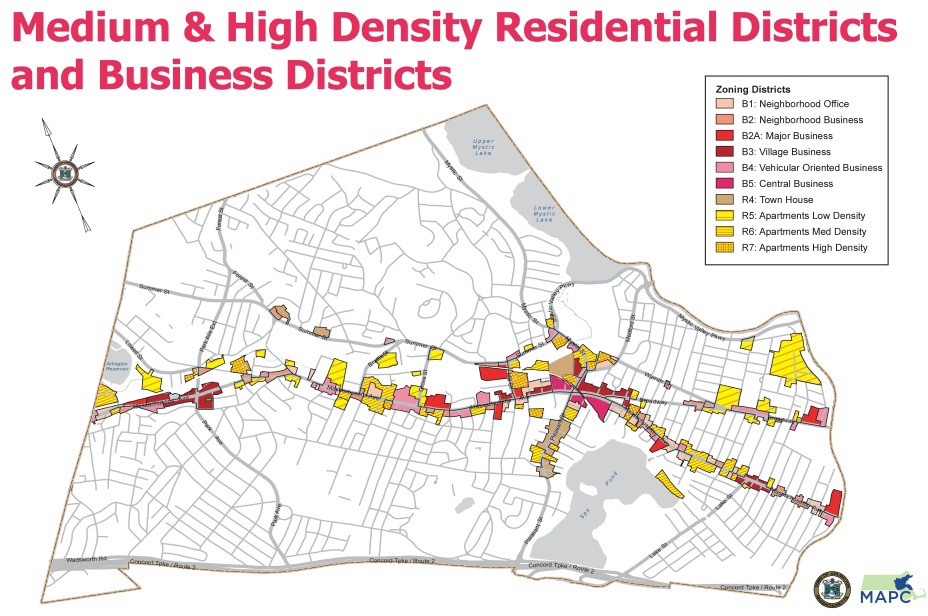
The discussions on zoning have been confusing because while zoning covers ALL of Arlington’s land and the zoning bylaws for all Arlington’s zones are referenced, the key issues of greatest interest to Town Meeting are the discussions about increasing density. These discussions pertain ONLY to those properties currently zoned as R4-R7 and the B (Business) districts. These density related changes would affect only about 7% of Arlington’s land area. The map shows the specific zones that would potentially be affected. They lay along major transportation corridors.
(This post originally appeared as a one-page handout, distributed at The State of Zoning for Multi-Family Housing in Greater Boston.)
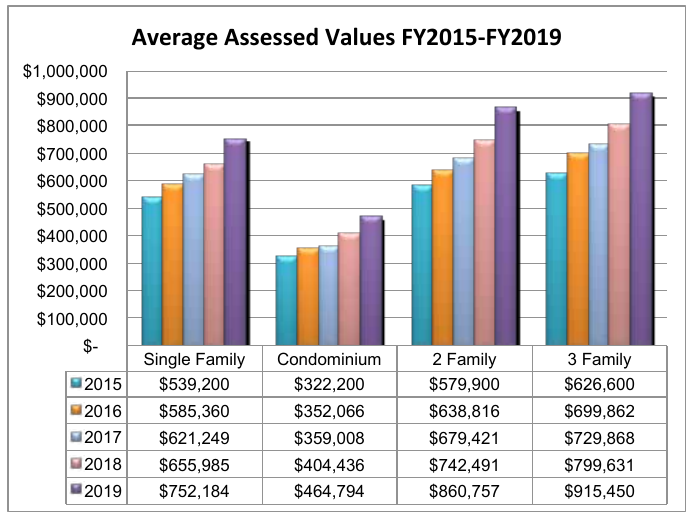
This chart shows the assessed value of Arlington’s low density housing from 2015–2019 (assessed values generally reflect market values from two years prior). During this time, home values increased between 39% (single-family homes) and 48% (two-family homes). Most of the change comes from the increasing cost of land. As a point of comparison, the US experienced 7.7% inflation during the same period. (1)
Arlington has constructed six apartment buildings in the 44 years since the town’s zoning bylaw was rewritten in 1975; we constructed 75 of them in the preceding 44 years.(2) Like numerous communities in the Metro-Boston area, we’re experiencing a high demand for housing, but our zoning regulations have created a paper wall that prevents more housing — including affordable housing — from being built.
Communities need adequate housing, but they also need housing diversity: different types of housing at different price points. The housing needs of young adults are different than the housing needs of parents with children, which are in turn different than the housing needs of senior citizens. As demographics change, housing needs change too. Keeping people in town means providing them with the opportunity to upsize or downsize when the need arises.
If Arlington’s housing costs had only increased with the rate of inflation, the cost of single family housing would average $581K, over $170K less than today. The median household income in Arlington is about $103K/year.(3) Buying an average single family-home with that income on a typical 30-year mortgage would require approximately 46% of a household’s monthly income.(4)
Either homes in Arlington will only be available to people who have much more substantial incomes than current residents, or the town will find a way to balance the rapidly growing cost of land against the housing needs of its current citizens, those still in school, those preparing to downsize as well as those looking for a bigger space.
In addition, Arlington’s commercial economy will thrive with a greater number of housing units so we can keep the empty nesters, and the new college graduates who have lived in the town for years, as well as welcome new Arlingtonians to support our local businesses, restaurants and other services.
Our Town, like others in the state, is looking for ways to balance the needs of our citizens with the market forces of rising land costs while maintaining a healthy, diverse community.
Footnotes
- The inflation amount comes from Inflation amount from https://data.bls.gov/cgi-bin/cpicalc.pl.
- Figures on multi-family unit construction are taken from Arlington Assessor’s data. They reflect multi-family buildings that are still used as rental apartments.
- Income levels come from 2013-2017 ACS 5-year data for Arlington, MA.
- Assuming 10% downpayment, 4% interest, $800/year for insurance, and Arlington’s $11.26 tax rate, the monthly mortgage payment would be nearly $4000/month.