In 2015 Town Meeting approved the Master Plan. Following is the Housing chapter of that plan. It contains a great deal of information about details of the housing situation in Arlington, challenges of housing price increases, needs for specialty housing, opportunities for meeting these needs, etc. The authors found that “most cities and towns around Arlington experienced a significant rise in housing values from 2000 to 2010. A 40 percent increase in the median value was fairly common. However, Arlington experienced more dramatic growth in housing values than any community in the immediate area, except Somerville. In fact, Arlington’s home values almost doubled.” This and related data helps explain why the need for affordable housing is now so acute.
Related articles
Restrictive covenants are a “list of obligations that purchasers of property must assume … For the first half of the 20th century, one commonplace commitment was a promise never to sell or rent to an African American”. [1] These covenants gained popularity after the Supreme Court’s 1917 decision in Buchanan v. Warley.
Rothstein’s book The Color of Law mentions examples from Brookline, MA; Arlington, MA has examples of it’s own. We’ll look at one from an East Arlington deed dating to 1923. Credit to Christopher Sacca for finding these documents.
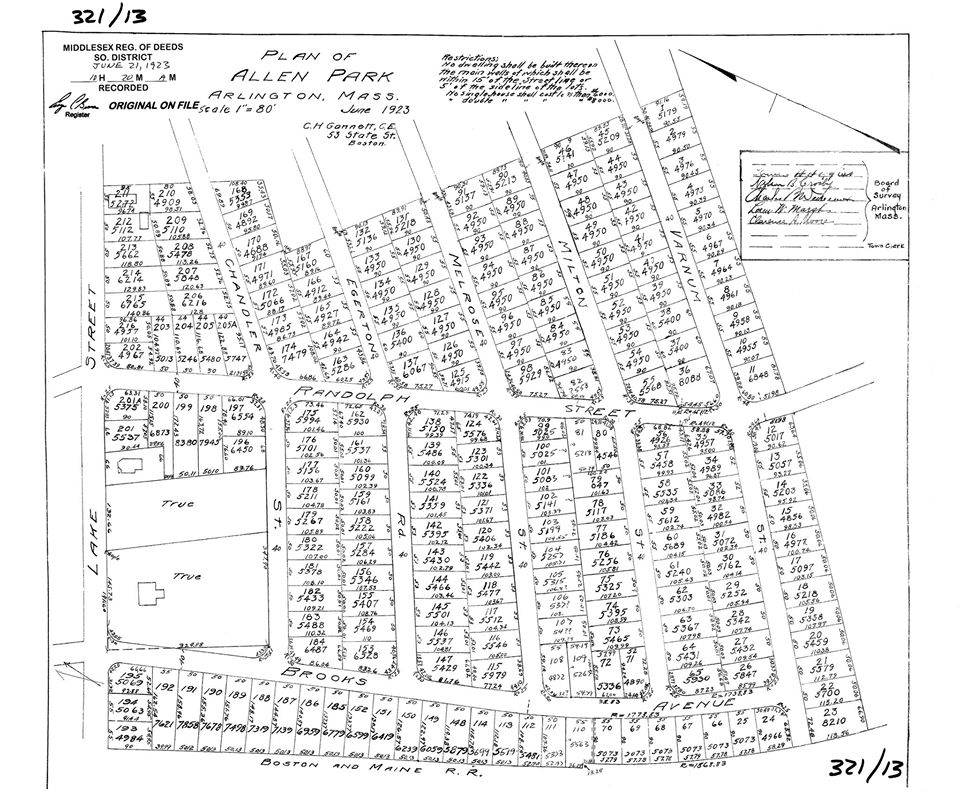
First, a land plan to establish content. Below is the subdivision plan for a farm owned by Herbert and Margaret Allen. I count a little over 200 lots in this subdivision. The plan itself states that “no single house shall cost less than $6,000 and no double house shall
cost less than $8,000″. This language also appears in the property deed.
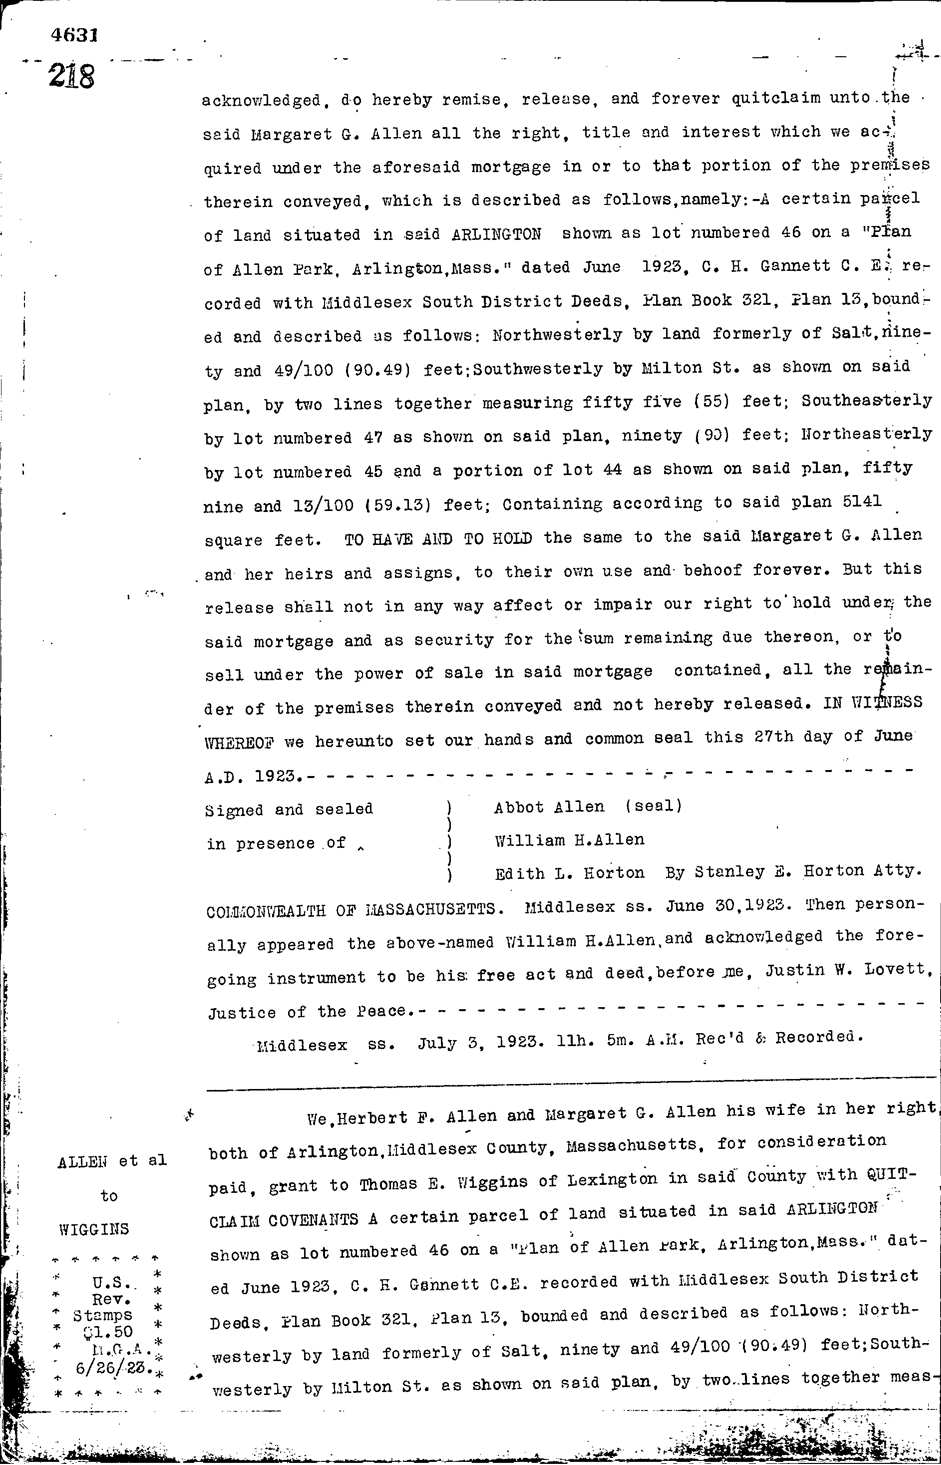
One of the deeds from these parcels appears in book 4631 page 218 and book 4631 page 219, in the Southern Middlesex registry of deeds.
Here’s page 218; the deed begins at the bottom.
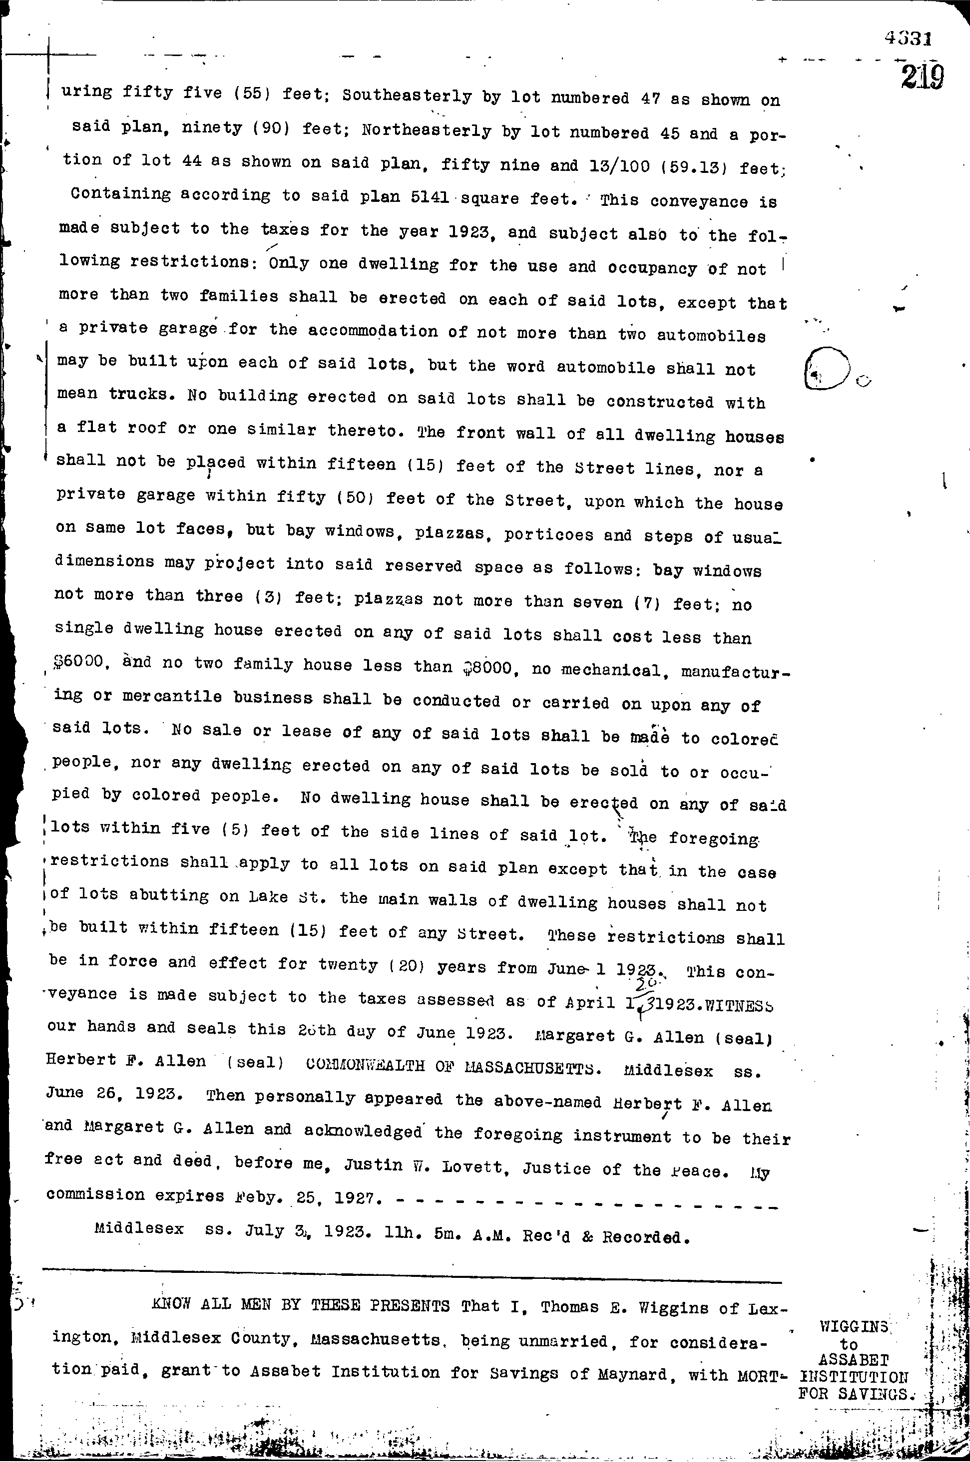
Here’s page 219. The racial covenant appears halfway down the page. It reads “No sale or lease of any said lots shall be made to colored people, no any dwelling on any said lots be sold or occupied by colored people”.
The 1920’s were a time of significant residential growth in Arlington, as farmers (called “Market Gardeners” at the time) subdivided and sold off their land. This example shows that Arlington, MA landowners employed some of the same discriminatory tactics for segregation as other communities in the United States. It would take further research to determine how common the use of such covenants was early twentieth-century Arlington.
Footnotes
[1] The Color of Law. Richard Rothstein. pg. 78

(by Steve Revilak)
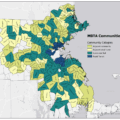
In 2021 the Massachusetts State Legislature passed the MBTA Communities act, which requires cities and towns served by the MBTA (aka “MBTA Communities”) to create districts where multi-family housing can be built by-right, without a disretionary approval process. The law was intended to help address the Commonwealth’s housing shortage, and to encourage more transit-oriented development. Building housing near transit and walkable areas has a lot of environmental benefits; it let’s people take trips without driving, lessens congestions, and cuts down on greenhouse gas emissions. It’s a solid strategey.
Arlington created its multi-family districts in the fall of 2023 and the Attorney General’s office approved them in June 2024. The laws have been on the books for just over a year — what kind of a difference are they making in Arlington?
2024 was a slow year for the MBTA Communities act in Arlington; there was one application which turned a two-family home on Belknap St into a pair of two-family homes, for a net change of two additional dwellings. 2025 has brought more activity. There are four applications under the review by the Arlington Redevelopment Board but none have been approved yet. These are:
- 225 Broadway, to convert a two-family home into a four-family,
- 126 Broadway, to convert a two-family home into a mixed use building with space for a business on the first floor, and 14 apartments,
- 18 Grafton, to convert a one-family home into a four-family, and
- 9-11 Robbins Road to convert a two-family home to nine apartments
There was an additional application to convert four apartments to five at 259 Broadway, but the applicant withdrew after their first hearing.
If all of these projects are approved, the net change will be an additional 26 homes, which represents a 0.1% increase relative to the 20,460 dwellings that Arlington had as of the 2020 census. It’s been a very slow trickle.
The MBTA Communities act was a meaningful reform which is just starting to make a difference. It’s bringing proposals for smaller multi-family homes that used to be the mainstay of our housing stock, but are generally rare today. However, the MBTA Communities Act is only one tool and Massachusetts will have to do more in order to build the 222,000 homes we need.