The new proposal is just the most recent step in a process that reaches back almost a decade, culminating in the Master Plan (2015), the Housing Production Plan (2016) and the mixed-using zoning amendments of 2016. The Town has consistently proposed smart growth: more development along Arlington’s transit corridors to increase the tax base, stimulate local commerce, and provide more varied housing opportunities for everyone, including low and moderate income Arlingtonians. This year’s proposals are no head-long rush into change. Today’s debate is similar to the debate before Town Meeting three years ago. If anything, progress has been frustratingly slow. To realize the Master Plan’s vision of a vibrant Arlington with diverse housing types for a diverse population, we must stay the course on which we have been embarked for so long.
Related articles
(This post originally appeared as a one-page handout, distributed at The State of Zoning for Multi-Family Housing in Greater Boston.)
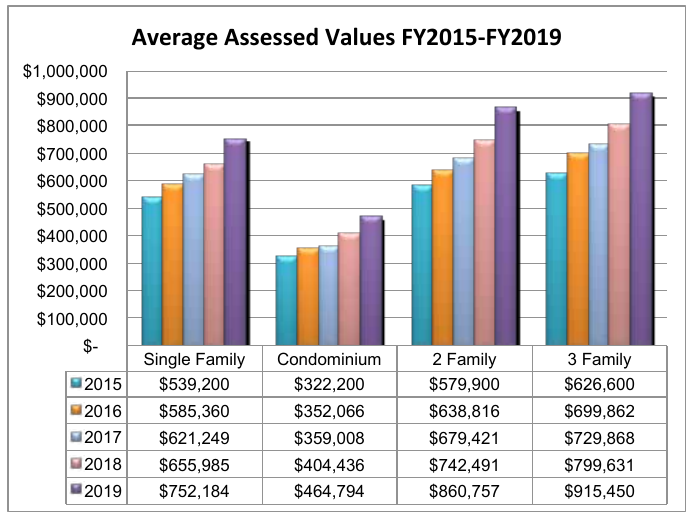
This chart shows the assessed value of Arlington’s low density housing from 2015–2019 (assessed values generally reflect market values from two years prior). During this time, home values increased between 39% (single-family homes) and 48% (two-family homes). Most of the change comes from the increasing cost of land. As a point of comparison, the US experienced 7.7% inflation during the same period. (1)
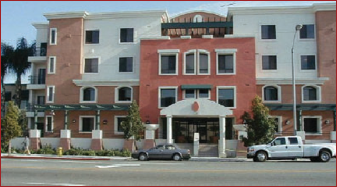
Arlington has constructed six apartment buildings in the 44 years since the town’s zoning bylaw was rewritten in 1975; we constructed 75 of them in the preceding 44 years.(2) Like numerous communities in the Metro-Boston area, we’re experiencing a high demand for housing, but our zoning regulations have created a paper wall that prevents more housing — including affordable housing — from being built.
Communities need adequate housing, but they also need housing diversity: different types of housing at different price points. The housing needs of young adults are different than the housing needs of parents with children, which are in turn different than the housing needs of senior citizens. As demographics change, housing needs change too. Keeping people in town means providing them with the opportunity to upsize or downsize when the need arises.
If Arlington’s housing costs had only increased with the rate of inflation, the cost of single family housing would average $581K, over $170K less than today. The median household income in Arlington is about $103K/year.(3) Buying an average single family-home with that income on a typical 30-year mortgage would require approximately 46% of a household’s monthly income.(4)
Either homes in Arlington will only be available to people who have much more substantial incomes than current residents, or the town will find a way to balance the rapidly growing cost of land against the housing needs of its current citizens, those still in school, those preparing to downsize as well as those looking for a bigger space.
In addition, Arlington’s commercial economy will thrive with a greater number of housing units so we can keep the empty nesters, and the new college graduates who have lived in the town for years, as well as welcome new Arlingtonians to support our local businesses, restaurants and other services.
Our Town, like others in the state, is looking for ways to balance the needs of our citizens with the market forces of rising land costs while maintaining a healthy, diverse community.
Footnotes
- The inflation amount comes from Inflation amount from https://data.bls.gov/cgi-bin/cpicalc.pl.
- Figures on multi-family unit construction are taken from Arlington Assessor’s data. They reflect multi-family buildings that are still used as rental apartments.
- Income levels come from 2013-2017 ACS 5-year data for Arlington, MA.
- Assuming 10% downpayment, 4% interest, $800/year for insurance, and Arlington’s $11.26 tax rate, the monthly mortgage payment would be nearly $4000/month.
This timely report on the question of affordable housing vs. density comes from the California Dept. of Housing & Community Development and mirrors the situation in the region surrounding Arlington MA.
Housing production has not kept up with job and household growth. The location and type of new housing does not meet the needs of many new house- holds. As a result, only one in five households can afford a typical home, overcrowding doubled in the 1990’s, and too many households pay more than they can afford for their housing.
Myth #1
High-density housing is affordable housing; affordable
housing is high-density housing.
Fact #1
Not all high density housing is affordable to low-income families.
Myth #2
High-density and affordable housing will cause too much traffic.
Fact #2
People who live in affordable housing own fewer cars and
drive less.
Myth #3
High-density development strains public services and
infrastructure.
Fact #3
Compact development offers greater efficiency in use of
public services and infrastructure.
Myth #4
People who live in high-density and affordable housing
won’t fit into my neighborhood.
Fact #4
People who need affordable housing already live and work
in your community.
Myth #5
Affordable housing reduces property values.
Fact #5
No study in California has ever shown that affordable
housing developments reduce property values.
Myth #6
Residents of affordable housing move too often to be stable
community members.
Fact #6
When rents are guaranteed to remain stable, tenants
move less often.
Myth #7
High-density and affordable housing undermine community
character.
Fact #7
New affordable and high-density housing can always be
designed to fit into existing communities.
Myth #8
High-density and affordable housing increase crime.
Fact #8
The design and use of public spaces has a far more
significant affect on crime than density or income levels.
See an example of a “case study” of two affordable housing developments in Irvine CA, San Marcos at 64 units per acre.
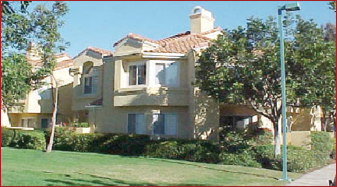
San Paulo at 25 units per acre.

Both are designed to blend with nearby homes.
You may not know who your Town Meeting Members are. You may not even know what precinct you live in. We’re here to help!
What’s My Precinct?
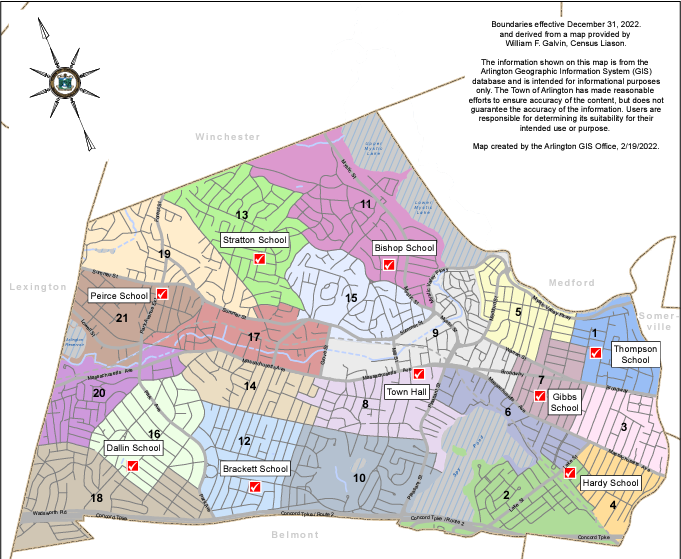
This PDF map of Arlington is divided by precinct. You may need to zoom in to see your precinct.
Who Are My Town Meeting Members?
The town of Arlington has a public list of town meeting members and their contact information. Send them an email telling them how you feel, or ask them if you can take a walk and discuss the MBTA Communities Plan.


Prepared by: Barbara Thornton with the capable assistance of Alex Bagnall, Pamela Hallett, Patrick Hanlon, Karen Kelleher, Steve Revilak and Jennifer Susse.
As Arlington considers new zoning and other policy decisions to increase the amount of affordable housing in the town, a concern has been raised about the threat of greater costs to the Town’s budget from new people with school age children moving into the town. The concern: additional children in the public schools costs the town more than the additional new property tax revenue the Town collects from the new housing.
This post examines this concern, drawing on data from two recent housing developments, representing 283 units of housing in Arlington, to determine that actually the Town budget gains over 4.5 times the actual cost of paying for the students. According to the most recent 2020 tax bills, the Town expects to collect $1,250,370 in revenue and to spend an additional $269,589 for the new Arlington Public School students living in these developments.
The data suggests that the fear of increased school costs, overwhelming the potential new revenue from new housing construction is not warranted.
For more information, see the full post here.