The new proposal is just the most recent step in a process that reaches back almost a decade, culminating in the Master Plan (2015), the Housing Production Plan (2016) and the mixed-using zoning amendments of 2016. The Town has consistently proposed smart growth: more development along Arlington’s transit corridors to increase the tax base, stimulate local commerce, and provide more varied housing opportunities for everyone, including low and moderate income Arlingtonians. This year’s proposals are no head-long rush into change. Today’s debate is similar to the debate before Town Meeting three years ago. If anything, progress has been frustratingly slow. To realize the Master Plan’s vision of a vibrant Arlington with diverse housing types for a diverse population, we must stay the course on which we have been embarked for so long.
Related articles


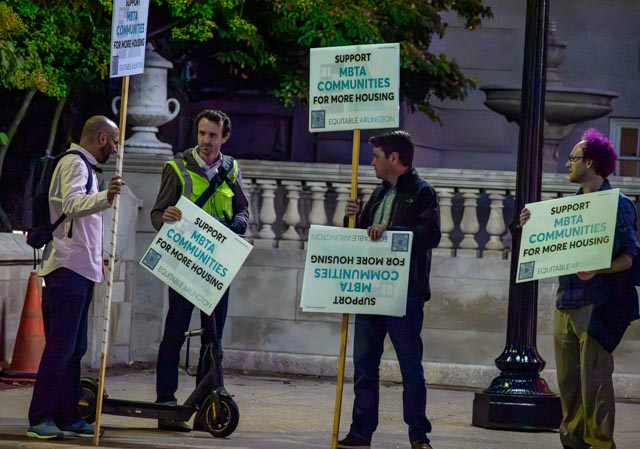
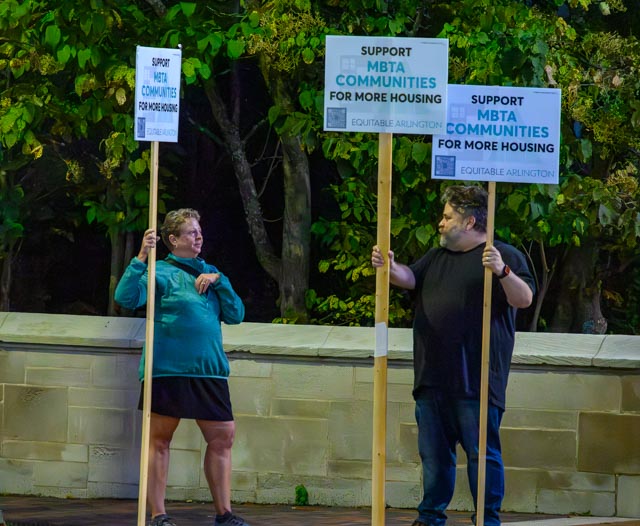
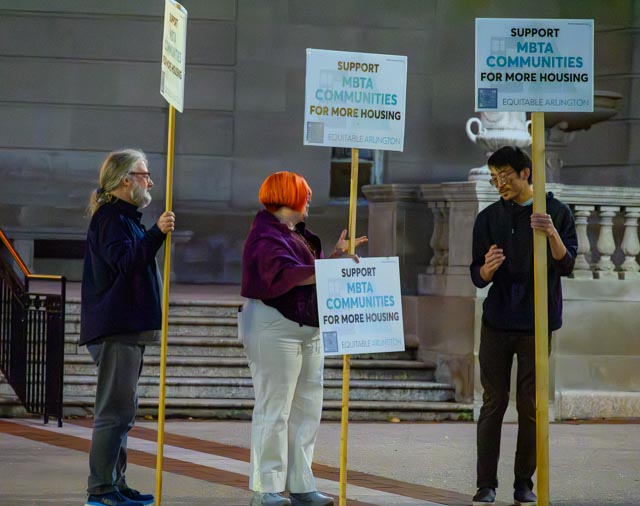
Thanks to so many of you who came out Monday evening for the demonstration in support of the MBTA Communities proposal before the Arlington Redevelopment Board meeting! Over 20 people were there – a substantial and notable showing, especially on such short notice. Paulette Schwarz took some photos of the demonstration early in the evening which she kindly shared with us.

Two weeks ago, I helped to organize a precinct meeting for residents and town meeting members. During the meeting, we got into a discussion about public open spaces, how the town funds their upkeep, and whether having more commercial tax revenue might provide additional funding for parks and recreation.
As I discussed in an earlier post, only about 5.6% of Arlington’s is zoned for commercial uses, and that limits the amount of commercial property tax revenue we can generate. Commercial property tax revenue is sometimes referred to as “CIP”, which stands for “Commercial, Industrial, and Personal”. Commercial and Industrial refer to property taxes on land and buildings that are respectively used for commercial and industrial uses. Personal tax is tax on the value of equipment that’s owned and used by a business for the purpose of carrying out whatever their business is. This could include things like desks, display fixtures, cooking equipment, fork lifts, and the like.
In 2020, Arlington’s CIP levy was 5.45%, meaning that 5.45% of our property tax revenue came from Commercial, Industrial, and Property tax revenue. Breaking this down further, 4.2% was commercial ($5,562,528 tax levy), 0.2% was industrial ($278,351 tax levy), and 1.1% was personal ($1,423,117 tax levy). The town’s total 2020 tax levy was $133,350,155. This data comes from MassDOR’s Division of Local Services, and I’ll provide more specific sources in the “References” section of this post.
A CIP levy of 5.45% is low (compared with other communities in the commonwealth), and occassionaly folks like to talk talk about how to raise it. Which is to say, we about how to raise the ratio of commercial to residential taxes. I moved to Arlington in 2007, when our CIP levy was 5.37%. This increased in subsequent years, peaking at 6.26% in 2013, and has been gradually decreasing since. Recall that 2008 was the year the housing market crashed, and the “great recession” began. The value of Arlington’s residential property fell, but the value of business properties was relatively stable in comparison. Thus, our CIP percentage got a boost for a couple of years.
Tax levies (the amount of tax collected) are a direct reflection of the tax basis (the assessed value of property). I’m going to shift from talking about the former to talking about the latter, because that will lead nicely to a discussion about property wealth. Which is to say, the aggregate value of property assessments in town.
Here’s a chart showing Arlington’s net CIP and residential property values, from 1983–2020, adjusted to 2020 dollars. (This is similar to the chart that appears on page 102 of Arlington’s Master plan, but for a longer period of time).
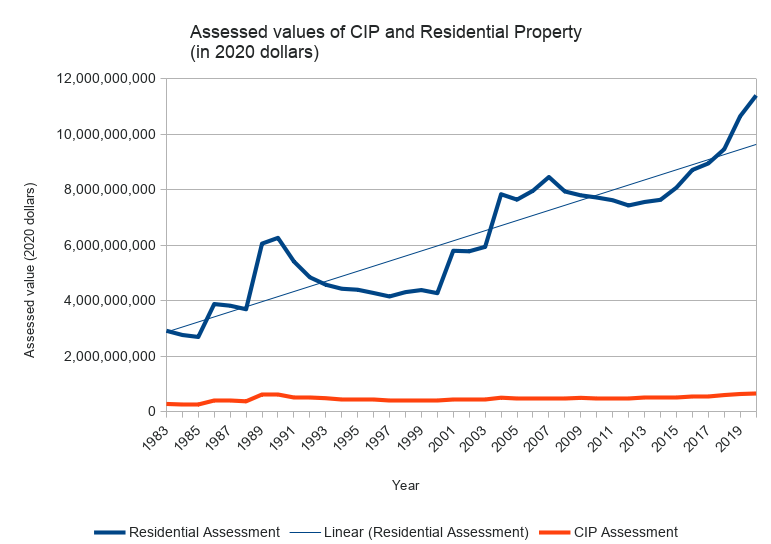
Generally speaking, the value of Arlington’s residential property has appreciated considerably, and there’s a widening gap between our residential and CIP assessments (in terms of raw dollars). Because the gap is so large, it’s helpful to see it on a log scale.
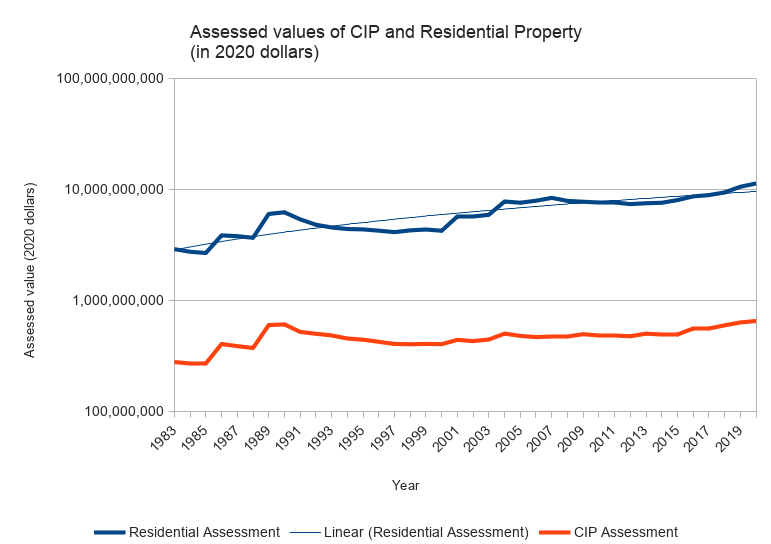
Viewed this way, the curvatures are generally similar, but residential property wealth is rising faster than business property wealth.
In summary, there are three reasons why our CIP is as low as it is: (1) a limited amount of land where one can run a business, (2) the value of residential property is appreciating faster than the value of business property, and (3) occasionally business properties are converted to residential (perhaps with the residential property being worth more than the former business property). That’s not to say we can’t improve the commercial tax base. We can, but we will have to think about what and where, and how to compete with a generally competitive residential market.
References
- MassDOR Division of Local Services reports
- DOR Query Tool for Municipal Property Assessments
- DOR Query Tool for Municipal Tax Levies
- Spreadsheet of Arlington Property Assessments, 1983–2020. Data obtained from MassDOR, with calculations added to adjust for inflation.
- Spreadsheet of Massachusetts Property assessments for 2020. Data obtained from MassDOR.
(Updated 7/2/2020, to add log scale graph and revise conclusion.)

(by Steve Revilak)
In 2021 the Massachusetts State Legislature passed the MBTA Communities act, which requires cities and towns served by the MBTA (aka “MBTA Communities”) to create districts where multi-family housing can be built by-right, without a disretionary approval process. The law was intended to help address the Commonwealth’s housing shortage, and to encourage more transit-oriented development. Building housing near transit and walkable areas has a lot of environmental benefits; it let’s people take trips without driving, lessens congestions, and cuts down on greenhouse gas emissions. It’s a solid strategey.
Arlington created its multi-family districts in the fall of 2023 and the Attorney General’s office approved them in June 2024. The laws have been on the books for just over a year — what kind of a difference are they making in Arlington?
2024 was a slow year for the MBTA Communities act in Arlington; there was one application which turned a two-family home on Belknap St into a pair of two-family homes, for a net change of two additional dwellings. 2025 has brought more activity. There are four applications under the review by the Arlington Redevelopment Board but none have been approved yet. These are:
- 225 Broadway, to convert a two-family home into a four-family,
- 126 Broadway, to convert a two-family home into a mixed use building with space for a business on the first floor, and 14 apartments,
- 18 Grafton, to convert a one-family home into a four-family, and
- 9-11 Robbins Road to convert a two-family home to nine apartments
There was an additional application to convert four apartments to five at 259 Broadway, but the applicant withdrew after their first hearing.
If all of these projects are approved, the net change will be an additional 26 homes, which represents a 0.1% increase relative to the 20,460 dwellings that Arlington had as of the 2020 census. It’s been a very slow trickle.
The MBTA Communities act was a meaningful reform which is just starting to make a difference. It’s bringing proposals for smaller multi-family homes that used to be the mainstay of our housing stock, but are generally rare today. However, the MBTA Communities Act is only one tool and Massachusetts will have to do more in order to build the 222,000 homes we need.