This is the second in a series of “Arlington 2020” articles. The first article looked at the number of one-, two-, and three-family homes and condominiums in Arlington, and how that housing stock has changed over time. This article will examine changes in the value of those properties. We’re going to look at “value” through the lens of property assessments, so we should start with an explanation of what property assessments are and how they’re used.
A property assessment is simply the Town Assessor’s best estimate of what a property is worth, based on market values. The assessor’s office inspects properties every ten years; during intervening years, assessments are adjusted based on sale prices of similar homes in a given tax neighborhood. For all practical purposes, assessed values tend to trail market values by two years. In my neighborhood, property assessments are spot on — my house was assessed at $501,000 in 2020; during 2018, sales of similar homes in the neighborhood ranged from $495,000 to $520,000.
Condominiums have a single assessed value, which includes land and buildings. Otherwise, assessed values are broken down into land value, building value, and yard items (e.g., a garage or a shed).
Assessed values are used to determine the tax rate. The assessors page on the town website has calculations in worksheet form, but for all practical purposes, it’s just a division problem. One takes the total tax levy and divides by the sum of all property assessments (in thousands of dollars), and that’s the tax rate. An individual’s taxes are the assessed value of their property (in thousands of dollars) multiplied by the tax rate. If an individual owns (say) 1% of the assessed value in town, that individual will pay 1% of the property tax levy.
The main point is that assessed values are based on market values, but with a two-year lag. Consequently, we can use them as a way to see how home prices have changed over time.
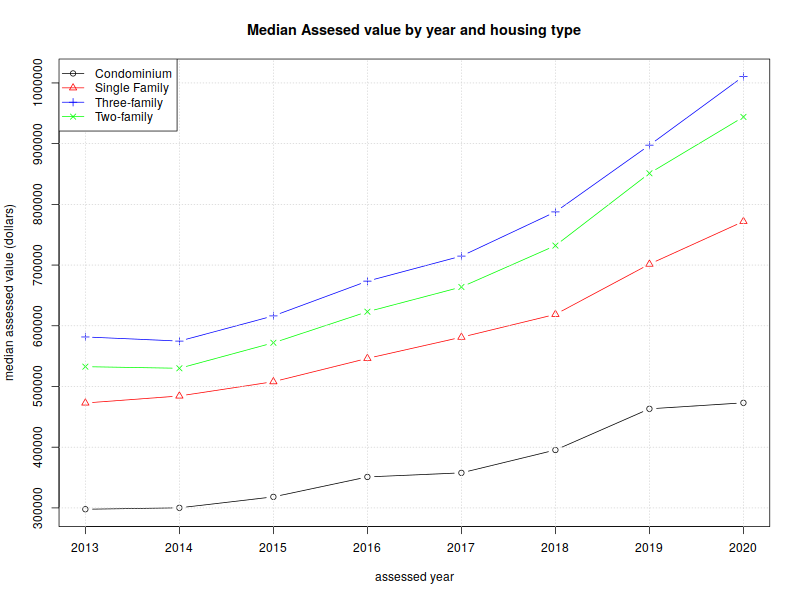
With that background information out of the way, we can look at some numbers. Here’s a graph of the median assessed values for condominiums, one-family, two-family, and three-family homes from 2013 through 2020. (the “median” is a value such that half of the assessments are above, and half are below).
| year | Condominium | Single Family | Two-family | Three-family |
| 2013 | $297,800 | $472,850 | $532,650 | $581,600 |
| 2014 | $300,150 | $484,400 | $530,000 | $574,800 |
| 2015 | $318,200 | $507,900 | $572,000 | $616,300 |
| 2016 | $351,050 | $546,300 | $623,150 | $673,550 |
| 2017 | $357,750 | $581,200 | $663,900 | $714,800 |
| 2018 | $395,400 | $618,800 | $732,100 | $787,600 |
| 2019 | $463,250 | $701,550 | $851,200 | $897,500 |
| 2020 | $473,100 | $771,900 | $944,000 | $1,010,850 |
| %change | 58.87% | 63.24% | 77.23% | 73.81% |
As one would expect, two-family homes are worth more than single-family, and three-family are worth more than two. Condominiums have a lot of variety; they could be half of a duplex, or a single unit in an apartment building. But a general upward trend is clearly evident.
These values are straight out of the assessor’s database, and not adjusted for inflation. The Bureau of Labor Statistic’s inflation calculator shows 12% inflation between 2013 and 2020; the %change is pretty considerable, even if one deducts 12% for inflation.
Next, I’d like to dig further into the 1–3 family assessments, by breaking them down into the value of land vs the value of buildings, and showing how that’s changed over time.
Single-family homes:
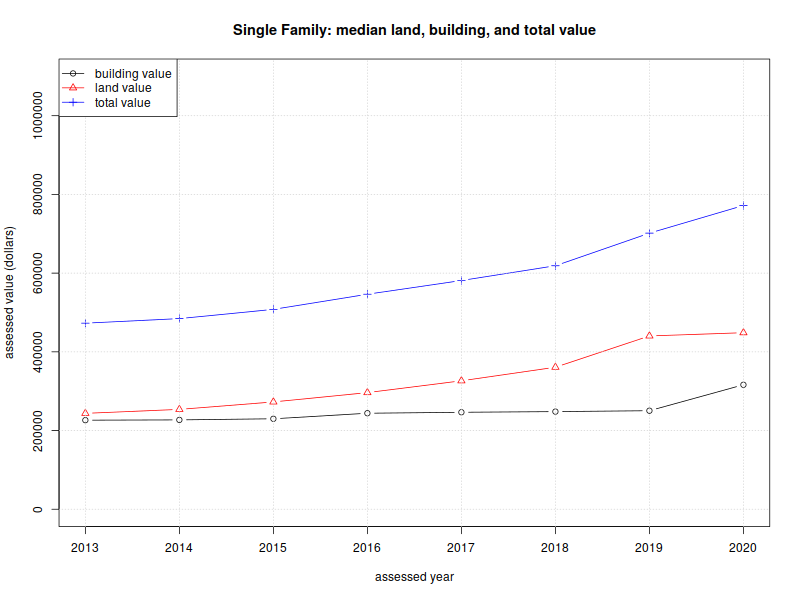
| year | Land value | Building value | Total assessed value |
| 2013 | $243,700 | $226,300 | $472,850 |
| 2014 | $253,750 | $227,050 | $484,450 |
| 2015 | $272,700 | $229,900 | $507,900 |
| 2016 | $296,400 | $243,950 | $546,400 |
| 2017 | $326,400 | $246,400 | $581,250 |
| 2018 | $360,900 | $248,100 | $618,800 |
| 2019 | $440,400 | $250,400 | $701,600 |
| 2020 | $448,600 | $316,300 | $771,900 |
| %change | 84.08% | 39.77% | 63.24% |
Two-family homes:
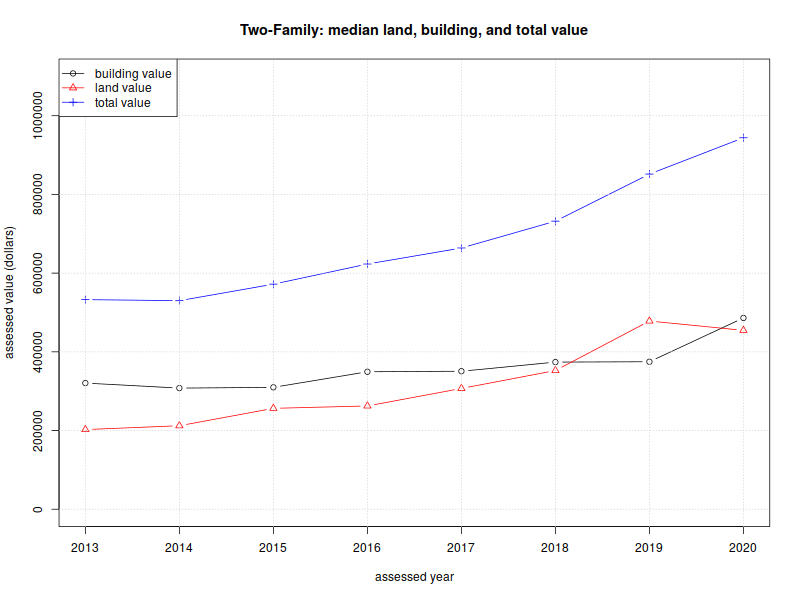
| year | Land value | Building value | Total assessed value |
| 2013 | $202,500 | $320,550 | $532,650 |
| 2014 | $212,250 | $307,800 | $530,000 |
| 2015 | $256,400 | $309,800 | $572,000 |
| 2016 | $262,500 | $349,400 | $623,150 |
| 2017 | $307,000 | $350,700 | $663,900 |
| 2018 | $352,500 | $373,900 | $732,100 |
| 2019 | $478,300 | $374,850 | $851,700 |
| 2020 | $454,500 | $486,100 | $944,000 |
| %change | 124.44% | 51.65% | 77.23% |
Three-family homes:
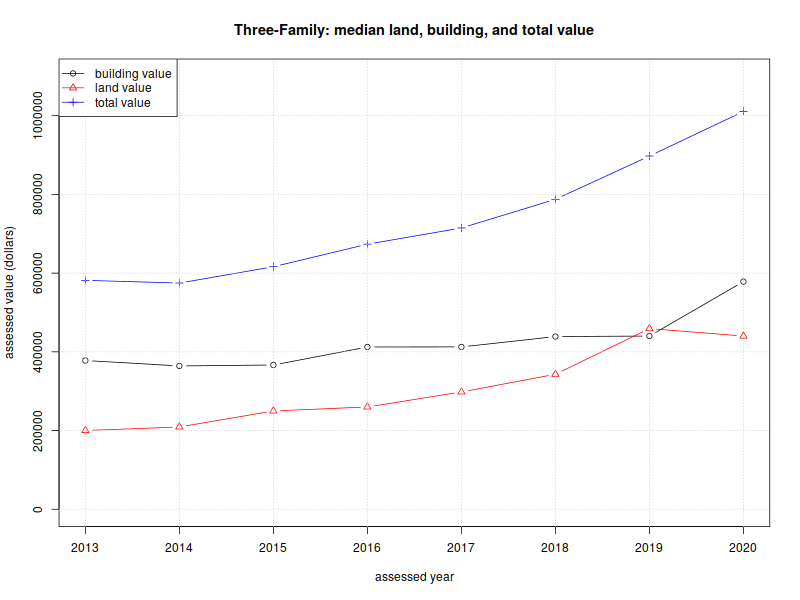
| year | Land value | Building value | Total assessed value |
| 2013 | $200,100 | $377,900 | $581,600 |
| 2014 | $209,100 | $364,100 | $574,800 |
| 2015 | $249,800 | $366,550 | $616,300 |
| 2016 | $259,950 | $412,350 | $673,550 |
| 2017 | $298,100 | $412,500 | $714,800 |
| 2018 | $343,050 | $438,800 | $787,600 |
| 2019 | $459,000 | $440,100 | $897,500 |
| 2020 | $440,100 | $578,450 | $1,010,850 |
| %change | 119.94% | 53.07% | 73.81% |
There are several things worth pointing out in these breakdowns.
First, note that the land and building values “jump” a bit between 2019–2020. 2020 was one of our full reassessment years, so I’m willing to attribute this to a periodic course correction. The total increase is generally linear, but the land/building composition has changed.
Second, the median land value for single-family homes is higher than the median building value, for all years between 2013–2020.
Third, most of the increases come from changes in land value. I believe this comes down to location, location, and location. Arlington has a well-respected public school system, and it’s close to universities and tech centers is Cambridge and Boston, and office parks in Lexington, Waltham, and Burlington. City amenities are close at hand.
So what does one do about our rising home prices, and in particular, the rising value of land? The first (and perhaps default) answer is to do nothing. Rising property values are a boon to homeowners who purchased a capital asset (i.e., a house) in the past, and have seen its value appreciate over time. The downside of doing nothing is that each year, increasing housing prices create an ever-increasing income threshold for new residents.
An alternative approach would be to allow more (and smaller) units to be built on each lot. This requires reconstruction or redevelopment, but it allows the cost of land to be amortized among several households. More units/lot means more people and more density, but it reduces the income threshold for buying in to Arlington. (Note that the per-unit cost for three-family homes is lower than the per-unit cost for two-family homes. Similarly, the per-unit cost for two-family homes is lower than the cost of a single-family home).
A third article will look at the distribution of housing prices in Arlington, and how the distribution varies by housing type.
Here is a spreadsheet of data shown in this post.