During the last few months, Arlington’s Department of Planning and Community Development and Zoning Bylaw Working Group have been conducting a study of the town’s industrial districts. The general idea has been to begin with an assessment of current conditions, and consider whether there are zoning changes that might make these districts more beneficial to the community as a whole.
To date, the major work products of this effort have been:
- A study of existing conditions, market analysis, and fiscal impact. Among other things, this slide deck will show you exactly where Arlington’s industrial districts are located.
- A set of test build scenarios.
- An initial set of zoning recommendations. These are high level ideas; they’d need further refinement to fit into the context of our zoning bylaws.
- A survey, to gather public input on several of the high-level recommendations.
The survey recently closed. I asked the planning department for a copy of they survey data, which they were generous enough to provide. That data is the subject of this blog post.
The survey generally consisted of pairs of questions: a yes/no or multiple choice, coupled with space for free-form comments. I’ll provide the yes/no and multiple choice questions (and answers!) here. Those interested in free-form commentary can find that in the spreadsheet linked at the bottom of this article.
208 people responded to the survey.
Industrial Zoning questions
(1) Which of the following uses would you support in the Industrial Districts? (check all that apply) (208 respondents)
| Industrial | 62.02% |
| Office | 76.92% |
| Breweries, Distilleries, and Wineries | 86.06% |
| Mixed Use (Office and Industrial Only) | 67.31% |
| Food Production Facilities | 55.77% |
| Flexible Office/Industrial Buildings | 68.27% |
| Coworking Space | 68.75% |
| Maker Space | 63.46% |
| Vertical Farming | 65.38% |
| Work Only Artist Studio | 63.94% |
| Residential | 42.79% |
| Other (please specify) | 12.02% |
(2) Would you support a waiver of the current 39-foot height maximum to allow heights up to 52 feet if the Applicant had to meet other site design, parking, or environmental standards? (207 respondents)
| Yes | 74.40% |
| No | 22.22% |
(3) Would you support a small reduction in the amount of required parking by development as an incentive to provide more bike parking given the districts’ proximity to the Minuteman Bikeway? (208 respondents)
| Yes | 68.27% |
| No | 30.77% |
(4) Would you support a variable front setback of no less than 6 feet and no more than 10 feet to bring buildings closer to the sidewalk and create a more active pedestrian environment? (207 respondents)
| Yes | 66.18% |
| No | 28.50% |
(5) Would you support zoning changes that require new buildings in the district to have more windows and greater building transparency, as well as more pedestrian amenities such as lighting, landscaping, art, or seating? (207 respondents)
| Yes | 81.64% |
| No | 13.53% |
Demographic questions
(7) Do you….(check all that apply) (206 respondents)
| live in Arlington | 99.51% |
| work in Arlington | 23.79% |
| own a business in Arlington | 9.71% |
| work at a business in one of Arlington’s industrial districts | 1.46% |
| own a business in one of Arlington’s industrial districts | 1.46% |
| patron of Arlington retail and restaurants | 76.70% |
| elected official in Arlington | 6.80% |
(8) What neighborhood do you live in? (207 respondents)
| Arlington Heights | 30.43% |
| Little Scotland | 2.42% |
| Poet’s Corner | 0.97% |
| Robbins Farm | 5.80% |
| Turkey Hill/ Mount Gilboa | 11.11% |
| Morningside | 4.35% |
| Arlington Center | 10.14% |
| Jason Heights | 8.21% |
| East Arlington | 20.77% |
| Kelwyn Manor | 0.00% |
| Not Applicable | 0.48% |
(9) How long have you lived in Arlington? (207 respondents)
| Under 5 years | 19.32% |
| 5 to 10 years | 15.46% |
| 10 to 20 years | 19.81% |
| Over 20 years | 45.41% |
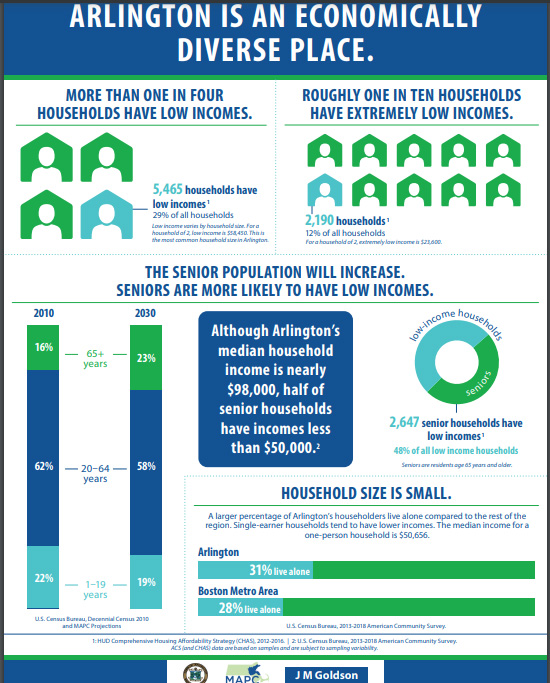
According to US Census data [1], 72% of Arlington’s residents moved to Arlington since the beginning of the 2000’s (i.e., 20 years ago or less). The largest group responding to this survey has lived here 20+ years, implying that the results may be more reflective of long-term residents opinions.
(10) Please select your age group (199 respondents)
| Under 18 | 0.00% |
| 18-25 | 1.01% |
| 26-35 | 13.57% |
| 36-45 | 22.11% |
| 46-55 | 25.13% |
| 56-65 | 20.60% |
| 66-80 | 16.58% |
| 80+ | 1.01% |
(11) What is your annual household income? (188 respondents)
| $0-$19,999 | 1.06% |
| $20,000-$39,999 | 1.60% |
| $40,000-$59,999 | 5.32% |
| $60,000-$79,999 | 9.04% |
| $80,000-$99,999 | 4.79% |
| $100,000-$149,999 | 23.94% |
| $150,000-$200,000 | 17.55% |
| More than $200,000 | 36.70% |
Full Survey Results
As noted earlier, the survey provided ample opportunity for free-form comments, which are included in the spreadsheet below. There were a number of really thoughtful ideas, so these are worth a look.
Arlington Industrial District Survey
Footnotes
[1] https://censusreporter.org/profiles/16000US2501640-arlington-ma/, retrieved August 10th, 2020
