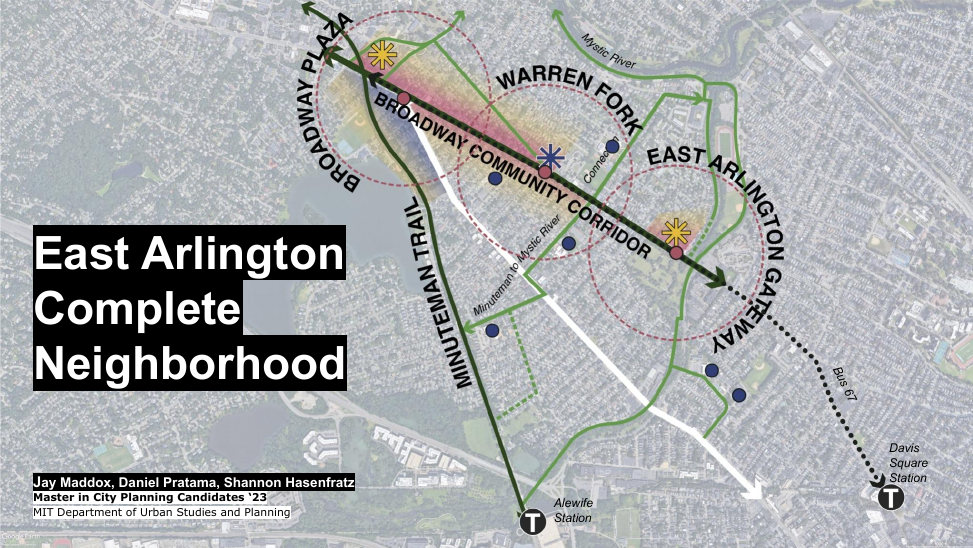
Jay Maddox maddoxja@mit.edu; Shannon Hasenfratz shasenfr@mit.edu; Daniel Pratama danielcp@mit.edu
Title: EAST ARLINGTON COMPLETE NEIGHBORHOOD
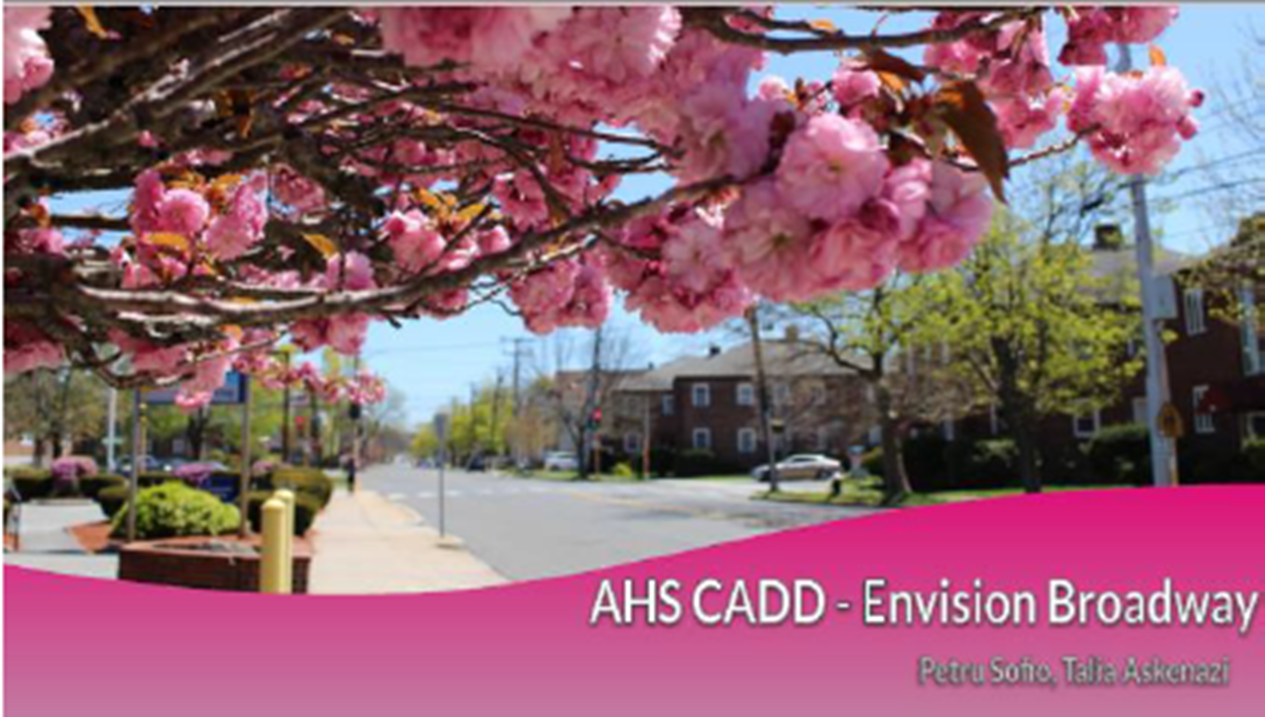
Petru Sofio psofio2024@spyponders.com; Talia Askenazi taskenazi2025@spyponders.com
Title: ENVISION BROADWAY
John Winslow john@winslowarchitects.com; Phil Reville philip@winslowarchitects.com; Dolapo Beckley dolapo@winslowarchitects.com
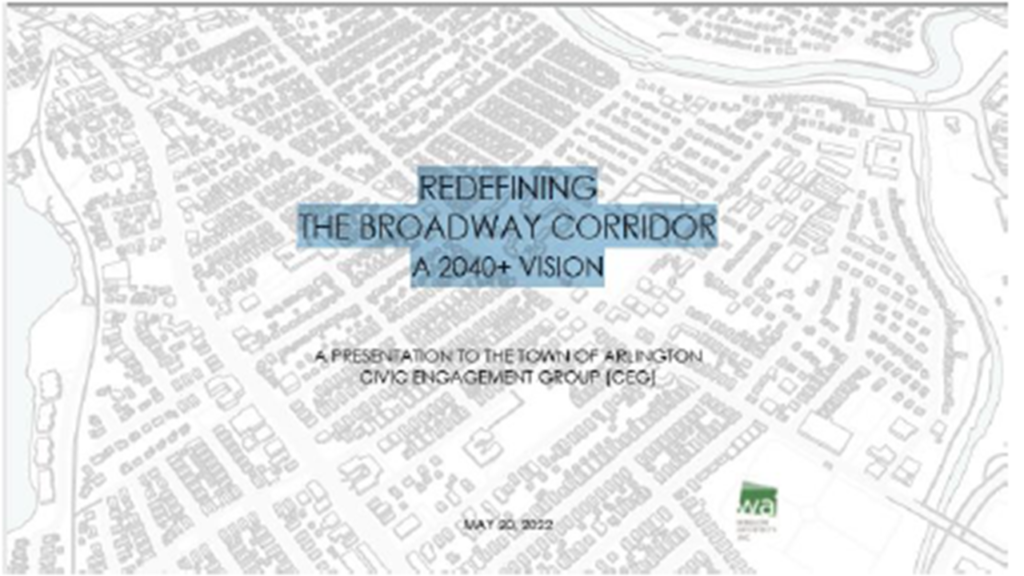
Title: REDEFINING THE BROADWAY CORRIDOR: A 2040+ VISION
Special thanks
The Civic Engagement Group (CEG), part of the Town of Arlington’s Envision Arlington network of organizations, is sponsoring the Broadway Corridor Design Competition. Architects, planners, designers and artists from around the region are encouraged to register by April 8, 2022.
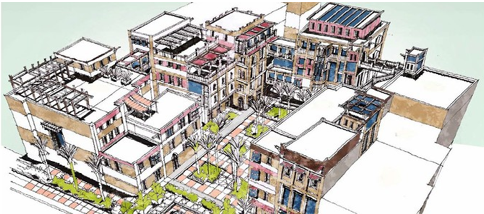
This as an opportunity for designers and architects in the region to have some fun exercising real creativity to leapfrog into the post pandemic future and create a 2040+ VISION of what the built environment of a specific neighborhood (our Broadway Corridor area) might look like.
Although the cash prize is small, the pay off will be bragging rights, recognition and a possible opportunity to help shape the upcoming Arlington master plan revision process.
The information: flyer
The plan: Design Competition launch plan
The background data: 2019 Broadway Corridor Study
Register to enter: Sign up information
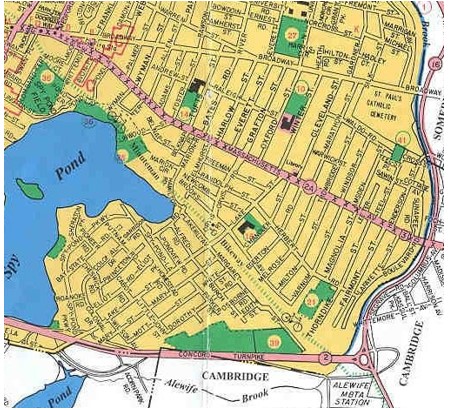
Broadway St. is a major bus route and transit corridor through Arlington to Cambridge. It is close enough to the Alewife MBTA Station to possibly be, at least partially, included in the planning for Arlington’s “transit area” status under the state Dept. of Housing and Community Development’s new guidelines.
A new report for Boston Indicators, “Exclusionary by Design”, shows the clear intent of many Greater Boston suburbs to resist racial and class integration in the 1970s. Housing scholar Amy Dain demonstrates how racial prejudice and class exclusion figured into suburbs’ downzoning in the 1970s; and how putatively legitimate concerns like tax revenue, aesthetic continuity, and the environment served the cause of exclusion.
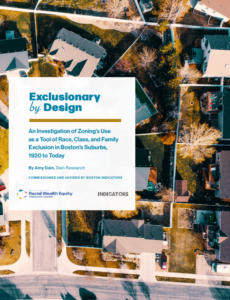
Read the “Exclusionary by Design” report, and see the accompanying 1-hour webinar with Amy Dain, Luc Shuster of Boston Indicators and Ted Landsmark of Northeastern University.
“This research finds widespread evidence that over the past 100 years, zoning has been used by cities and towns across Greater Boston as a tool for excluding certain groups of people, including:
- Racial minorities, especially Black residents
- Lower-income and working-class residents
- Families with school-aged children• Religious minorities
- Immigrants
- And, in some cases, any newcomers/outsiders at all”
In the 1970s, municipalities were ordered by state law to create Growth Policy Statements – but with no mandate that communities actually endorse growth nor inclusion. Exclusionary language in these statements was seemingly anodyne, seeking to preserve the “present characteristics of their communities” or “socio-economic status“. In several cases the fear of integration was quite apparent: Milton’s statement referred to problems in “surrounding communities” (ie Mattapan and Dorchester) and “breakdown of society”; both Milton and Melrose make mention of the pressures caused by people “moving out of Boston”. Belmont’s plan explicitly calls for the town to stay “relatively expensive … [so as to] attract only those families so economically situated.”
The intent of such language was not somehow lost on people in that era. Needham’s Local Growth Policy Statement included, but pointedly disavowed its own “Appendix A” — a dissenting statement by the Congregational Church of Needham, calling out the town’s exclusionary aims and endorsing a vision of inclusive growth.
In addition, in many places where multi-family housing was theoretically allowed, “poison pill” requirements and impediments were added to make such building a practical impossibility. More recently we have seen the ironic use of infeasible “inclusionary zoning” requirements – which ensure that no affordable housing can actually be built.
The same language, un-evolved and unrefined, is still invoked by “neighborhood defenders” today. Our current housing affordability crisis and segregation is the plain result. The report is a sobering, enlightening read – essential for any active citizen or town official in eastern Massachusetts.
(By Vince Baudoin and James Fleming)
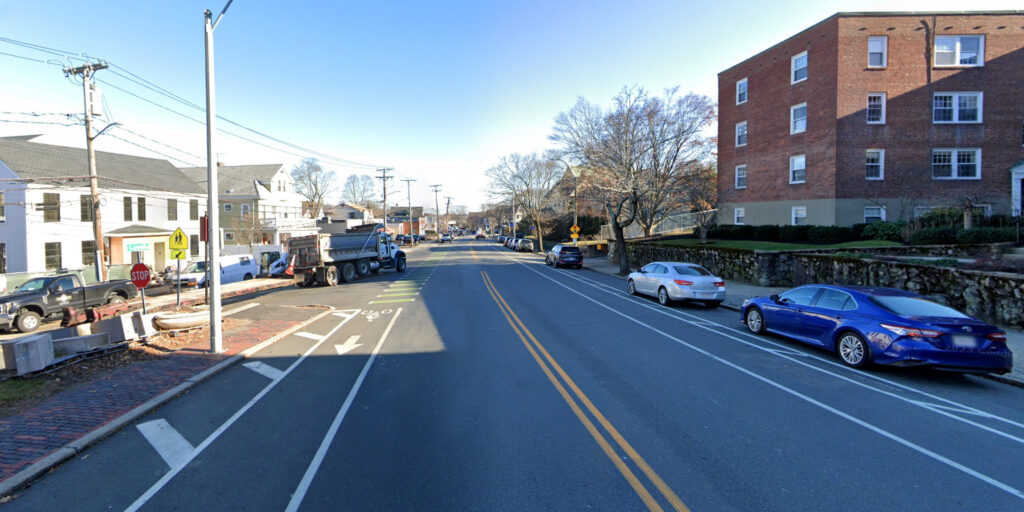
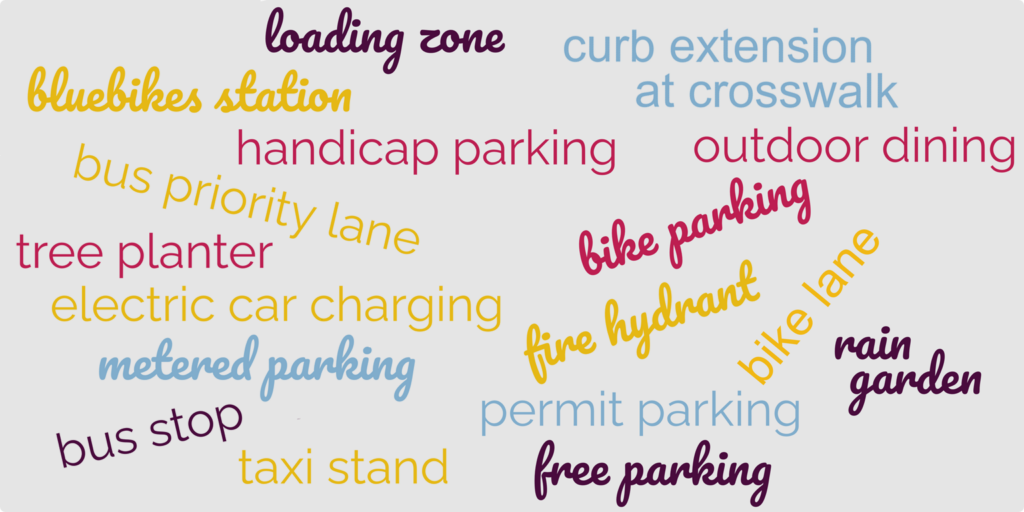
Could Arlington be better using its curb space? Here are some ways the curb can be used to create green infrastructure, promote public safety and accessibility, support sustainable transportation, strengthen business districts, and enable new ‘car-light’ development.
Roughly six inches high and made of concrete or granite, the curb marks the edge of the roadway, channels runoff, protects the sidewalk, and gathers stray leaves. When not assigned any other use, the space in front of the curb it usually serves as free storage for personal automobiles.
Yet the humble curb is a limited resource that can serve the community in many more ways. Have you thought about how your town budgets its curb space? For that matter, has your town thought about how it budgets its curb space?
While Arlington mostly uses its curb space for parking, some areas have other curb uses designed to achieve a specific goal. Consider the streets you use often. Have you seen an unsolved problem, or a missed opportunity, that a different use of the curb could help solve?
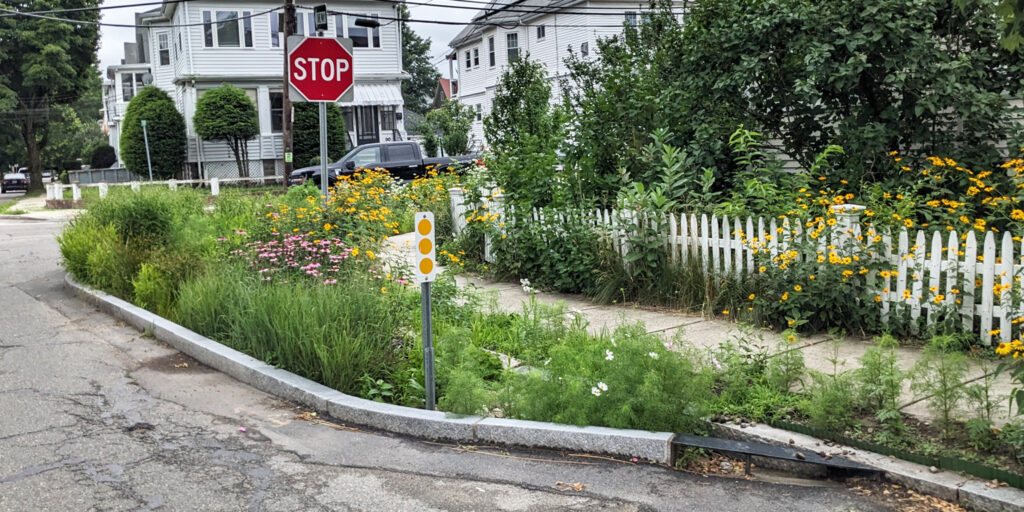
The Town has miles of paved roadway. When it rains or snows, water runs into storm drains, carrying salt, oil, and other pollutants with it. The storm drains dump these pollutants directly into long-degraded waterways such as the Mill Brook, Alewife Brook, and the Mystic River. The Public Works department struggles to keep grates clear and drains from overflowing.
One solution: Use the curb for more greenery! The curb can be extended to create a rain garden or tree planting strip. The rain garden helps slow runoff and filter the water before it enters the drain, while trees benefit from additional room for the roots to grow without damaging the sidewalk. A side benefit: narrowing the street encourages drivers to slow down, making neighborhoods safer.
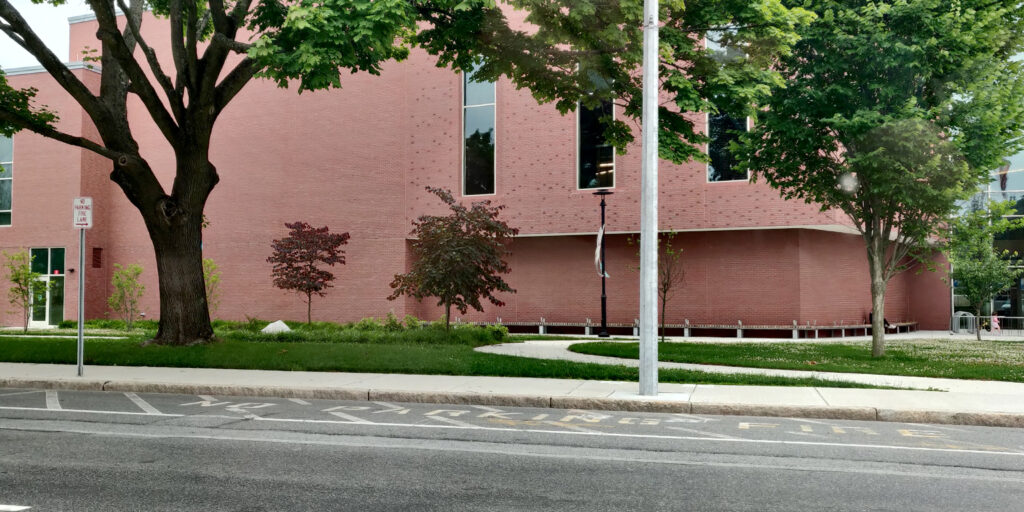
Often, portions of the curb are set aside for public safety purposes. For example, a fire lane provides fire department access to key buildings, such as the high school, shown below. Fire hydrants also enjoy special curb status.
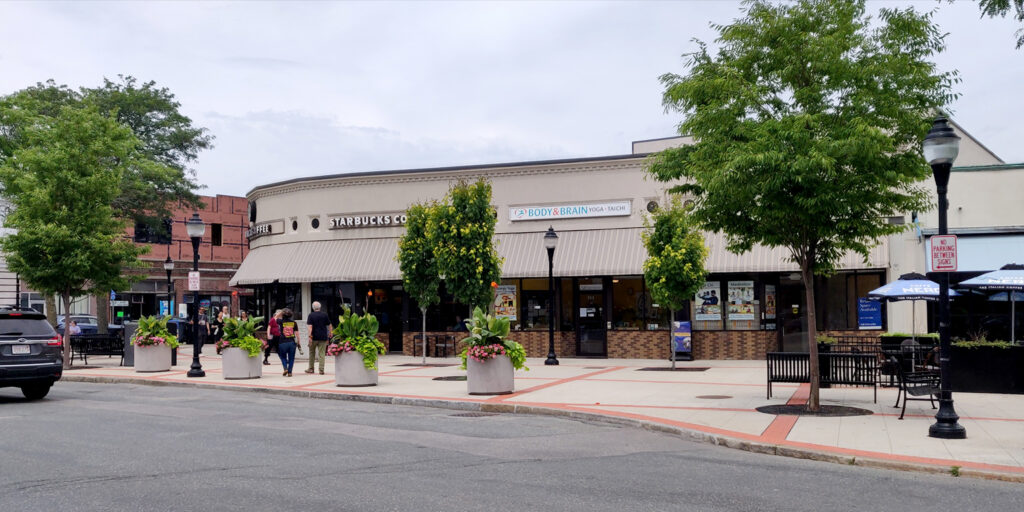
Other times, no-parking zones are established to enhance the free flow of traffic, such as here at Broadway Plaza:
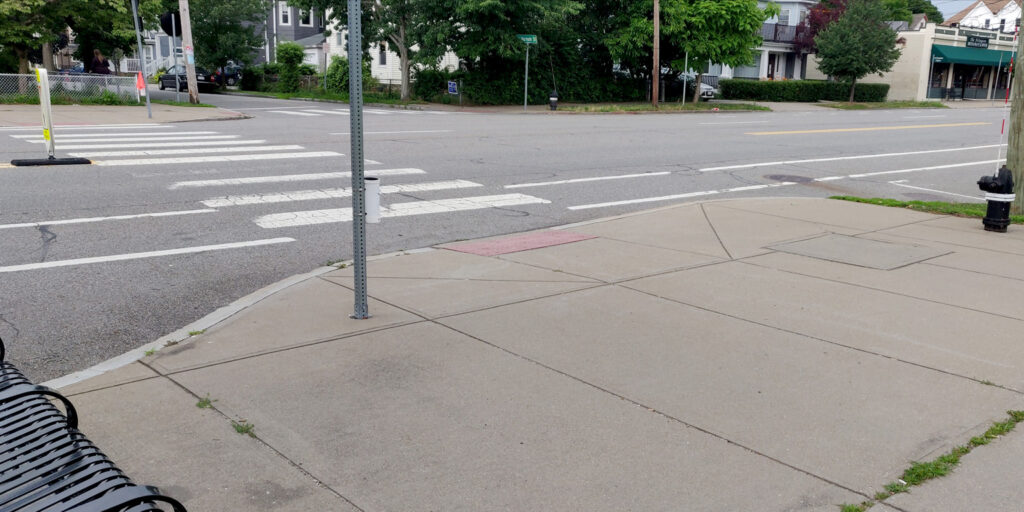
Where pedestrian crosswalks are present, a curb extension is a key safety enhancement. By narrowing the roadway, the curb extension encourages drivers to slow down and look for pedestrians. For pedestrians, it reduces the distance they must cross and prevents cars from parking directly next to the crosswalk and blocking visibility.
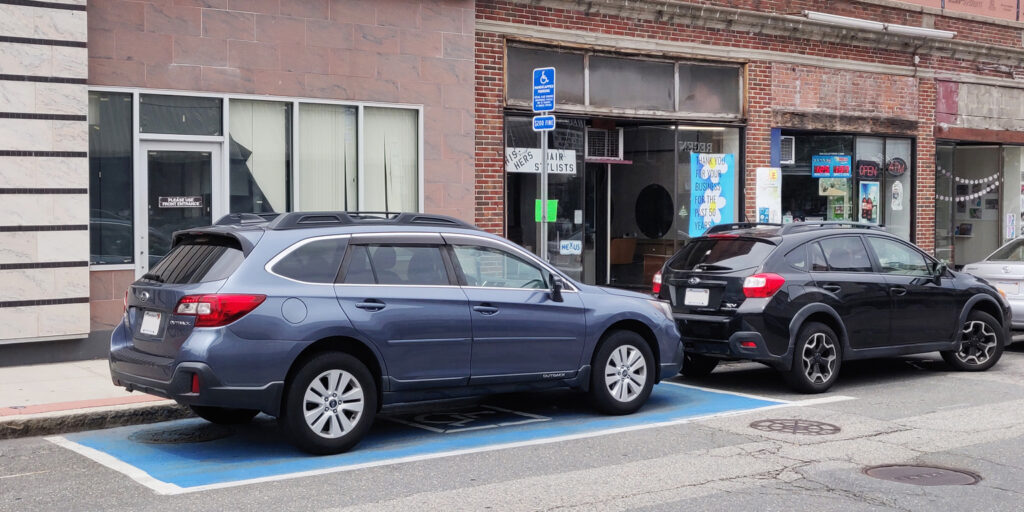
Finally, accessible parking spaces can be created along the curb. Arlington has at least 50 designated permit-only on-street parking spaces that provide convenient parking for residents with mobility issues or other disabilities.
When the curb is mostly used for cars, it is easy to overlook how curbside facilities can enhance other forms of transportation.
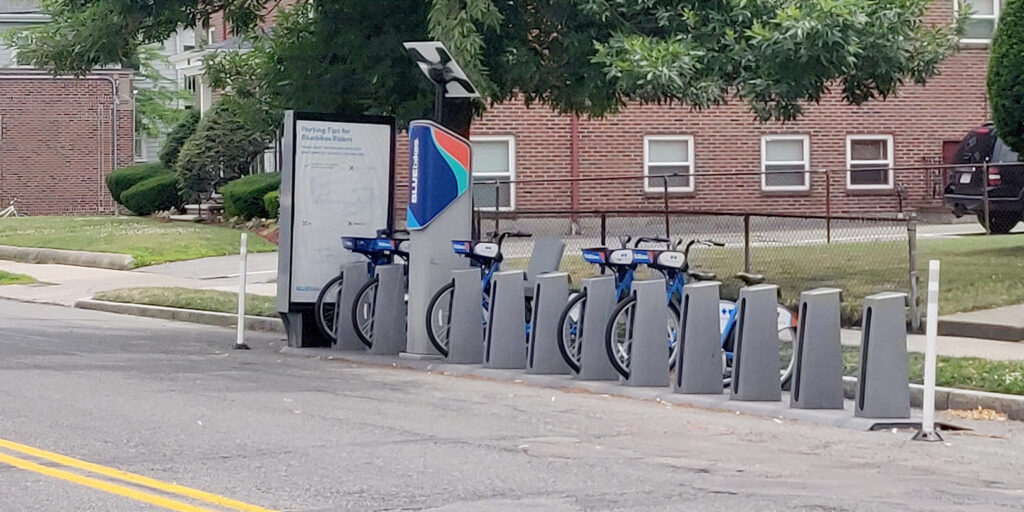
In the space of one or two parked cars, this bikeshare station offers space for 11 bikes. However, because it is installed on the roadway, it must be removed every winter so that snow can be cleared. If the curb were extended, the bikeshare station could be used year-round. Another nice feature is bicycle parking: the space to park one car can be used to park six or more bicycles.
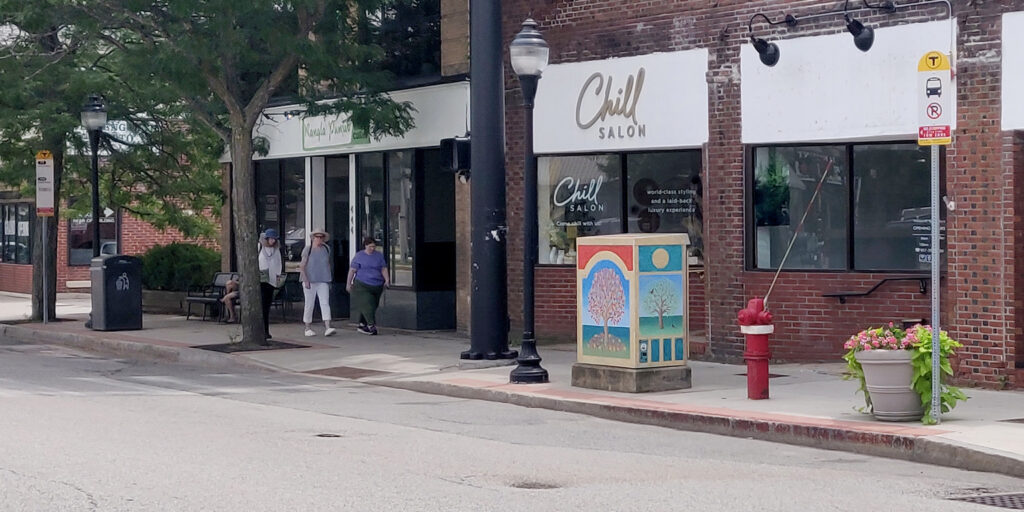
A bus stop allows buses to pull to the curb. In some cases, it is appropriate to extend the curb so the bus would stop in the traffic lane; otherwise, it may experience delays when it merges back into traffic.
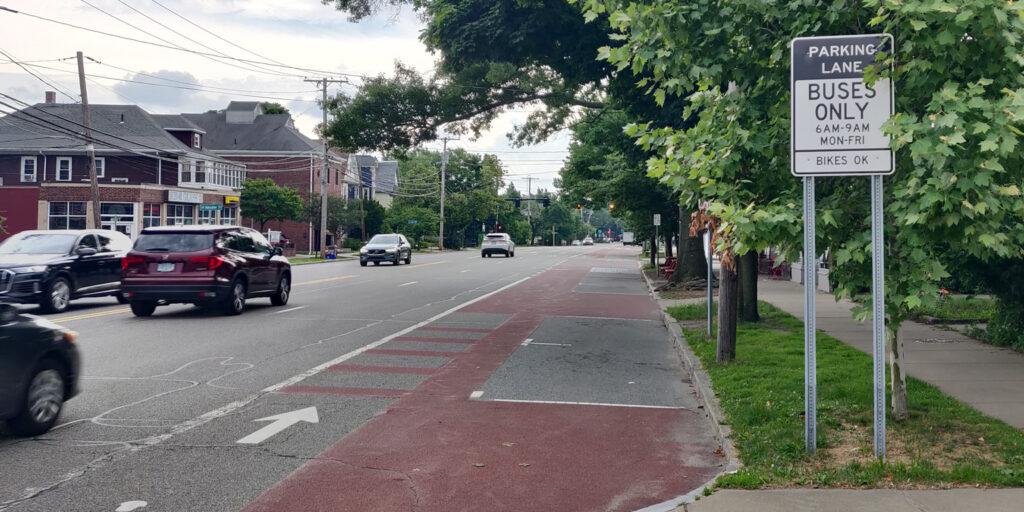
A bus priority lane provides a dedicated right of way for buses, helping to improve on-time performance. To date, these lanes extend only a few hundred feet into Arlington along Mass Ave. They have proven beneficial in many other communities.
Bike lanes, particularly if they are separated from cars by a physical buffer, greatly enhance the safety and comfort of people traveling on two wheels.
But with a limited roadway width, adding bike lanes is difficult unless the community is flexible enough to consider consolidating curb parking on one side of the street, or moving it to side streets entirely.
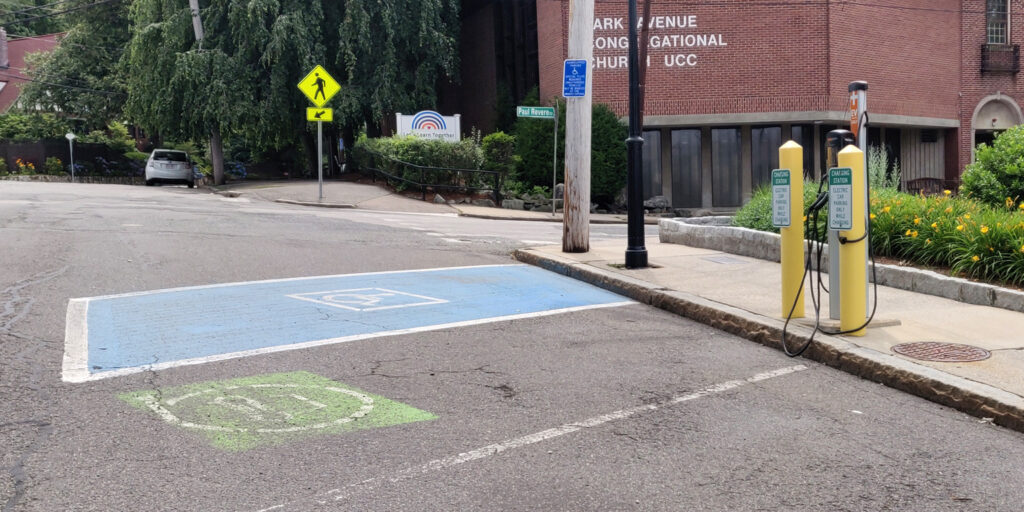
Finally, the Town could expand the use of on-street spaces for electric vehicle charging stations, such as this one on Park Ave:
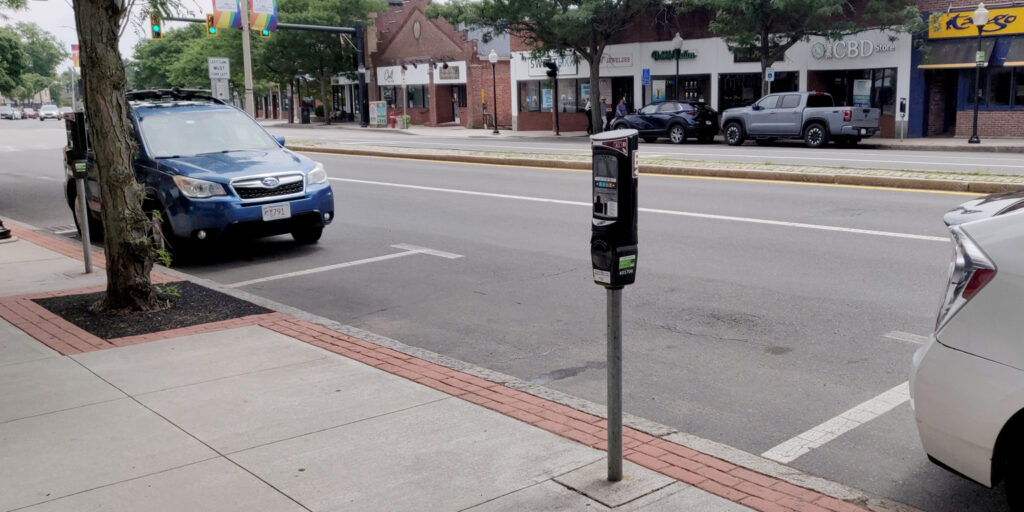
Nowhere is the curb more valuable than in business districts. Businesses thrive when their customers have a convenient way to reach them. Metered parking encourages people to park, do their business, and move along so another patron can take that space. Revenue from parking meters can be spent to improve the business district–for example, by planting flowers and trees.
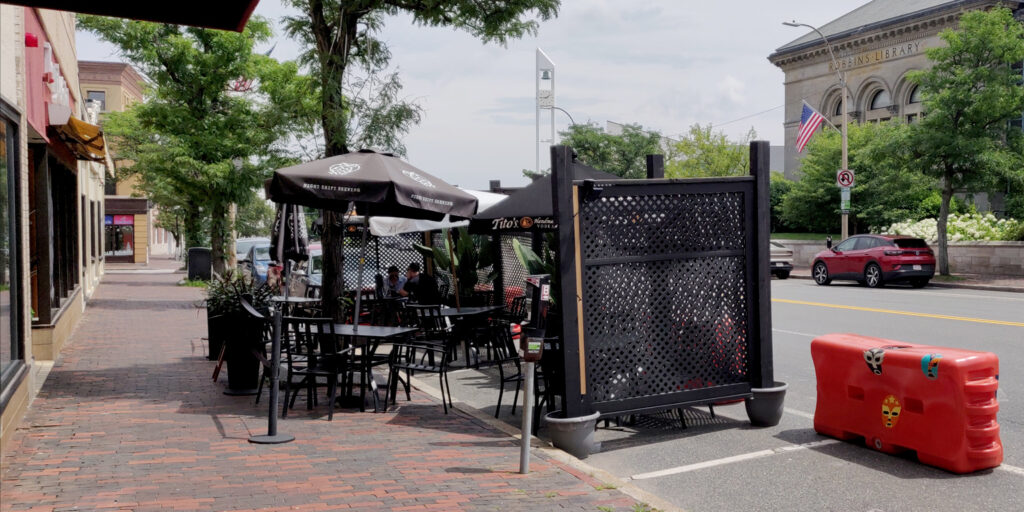
Metered parking is not the only valuable use of curb space in a business district. Outdoor dining is a way the Town can directly support its restaurants by enabling them to serve additional customers. Here is one example in Arlington Center:
And in Arlington Heights:
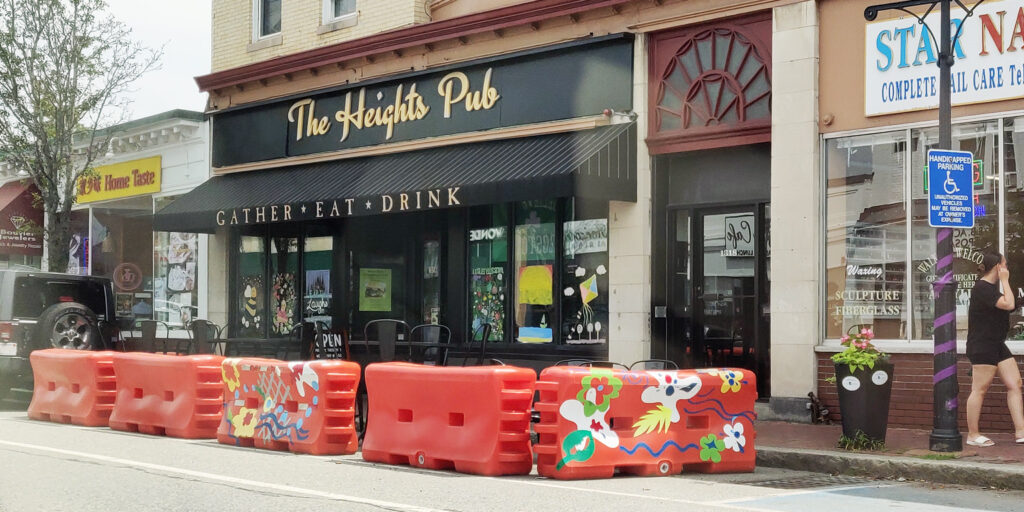
Other valuable curb uses in business districts include taxi stands and loading zones. Loading zones in particular are crucial to businesses’ success and help prevent the street from being clogged by early-morning delivery trucks, late-night food-delivery vehicles, and everything in between.
With high housing costs and a relatively small commercial tax base, Arlington could benefit from some kinds of development. However, land is valuable and lots are small, so if new buildings are required to have large parking lots, it is very difficult to build new homes and businesses. Plus, large parking lots bring more cars and more traffic. But better curb management can help resolve this dilemma, supporting car-light development that is more sustainable and affordable.
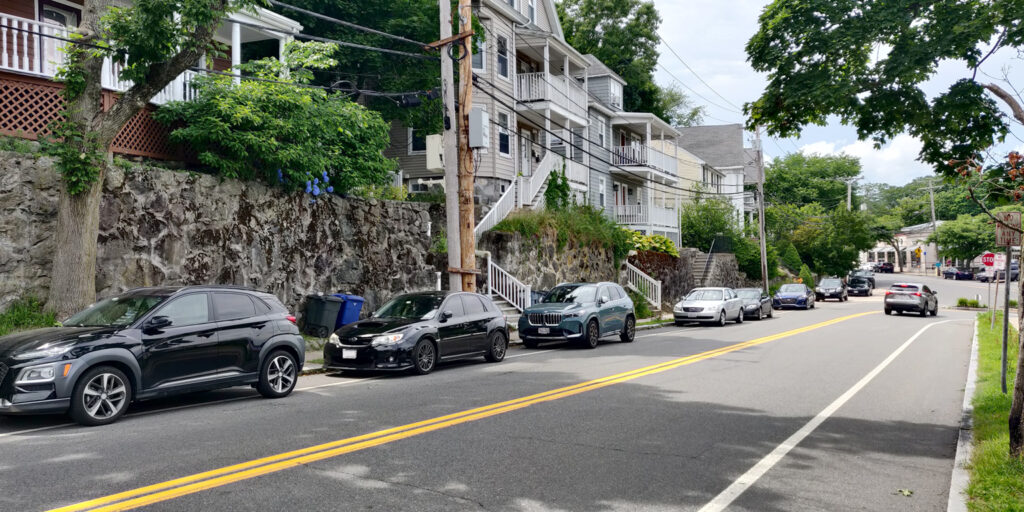
For example, on-street permit parking can enable nearby development with few or no off-street parking spaces. New housing or businesses are a better use of land than parking and will generate more property tax revenue. When parking permits are priced appropriately, they are available to residents who need them but discourage households from adding extra cars they do not need.
Take these hillside houses: access to on-street parking made it possible to build on a steep hillside, where it would have been too expensive and difficult to blast to create off-street parking.
Ask your town leaders if they have a curb management strategy. Is the Town using its limited curb space in support of goals such as green infrastructure, public safety and accessibility, public transportation, local business, and car-light development?


Equitable Arlington, along with City Life/Vida Urbana and the Harvard Legal Aid Bureau, supports the legacy tenants of 840/846 Massachusetts Avenue in their resistance to rent increases of up to 50%. We urge the buildings’ owner, Torrington Properties, to continue negotiating an agreement with the tenants rather than pursue legal action likely to end in housing court. If more gradual increases are incompatible with Torrington’s business plan, we hope to see the sale of the property to the Housing Corporation of Arlington or another buyer who is committed to keeping the existing tenants in their homes.

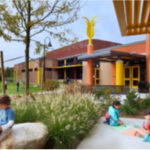
The property, whose two larger buildings date to 1940 and 1963, faces Arlington High School, within easy reach of shopping and transit. It occupies one of relatively few spots in Arlington where people can live without a car. (Equitable Arlington and the MBTA Communities plan seek to encourage exactly this kind of housing.) Many of the middle- and lower-income tenants have been there for decades, including teachers, musicians, and some Section 8 voucher recipients. Some are immigrants with limited English. Laura Frost, who has lived there for 20 years, describes the apartments as “unofficial,” and therefore legally unprotected, affordable housing. Erica Schwarz, executive director of the Housing Corporation of Arlington, concurs: “There are so few places where low-income tenants are in units that aren’t restricted.”

When Torrington Properties bought the buildings in 2019, it did not raise rents right away. Instead, the company pursued a familiar strategy of remodeling apartments when tenants moved out and then marketing them as “luxury” units. More recent arrivals are paying typical market rents. Of the longtime residents, several have left because they were worried about being pushed out to make way for more remodeling and steep rent increases, says Frost, who leads the tenants’ association. All have been tenants at will since Torrington bought the property, with their rents not rising but also not guaranteed by 12-month leases. In November 2022, she says, Torrington distributed a list of target rents for all of the units. A few months later, it informed legacy tenants, then about 20 in number, that they needed to either sign leases at the new rates or move out.
“Our position was never ‘You can’t raise rents ever,’” says Frost, who recognizes that Torrington can legally set rents at any level. Working with City Life/Vida Urbana, she hoped for an agreement for more gradual rent increases, like the one Torrington had just reached with tenants near Forest Hills in Boston. By last spring, however, negotiations had broken down. A rally she organized in September drew Reps. Garballey and Rogers. In February, Torrington sent the legacy tenants notices to quit. We are encouraged that negotiations have since resumed. At the same time, we support a more sustainable option for these tenants and anyone who lives there in the future, as well as Arlington as a whole: a commitment, perhaps by a new owner, to keeping some units affordable in the long term.
Schwarz, of the Housing Corporation of Arlington, has discussed purchasing the property from Torrington, which named a price she describes as “a few million dollars more” than HCA can offer. She has been exploring alternative ways to structure a purchase. This would include drawing on the Town of Arlington’s ARPA funds, as well as seeking mission-aligned equity partners for the project under a “mixed income” model. This would not displace any current tenants, but would, over time, provide a very high percentage of affordable units at a range of income levels, while also providing middle-income and market rate units.
Equitable Arlington supports common-sense reforms that allow for more housing options and tenant protections for current and future Arlington residents. We support increased funding for affordable housing, both through the Affordable Housing Trust Fund and state and federal subsidies, and a wider range of housing choice for every income level and every life stage. We also champion housing that is sustainable, equitable, and accessible, including locating additional housing near public transportation, all of which we believe will make Arlington an even more welcoming community.
Prepared by: Barbara Thornton with the capable assistance of Alex Bagnall, Pamela Hallett, Patrick Hanlon, Karen Kelleher, Steve Revilak and Jennifer Susse.
As Arlington considers new zoning and other policy decisions to increase the amount of affordable housing in the town, a concern has been raised about the threat of greater costs to the Town’s budget from new people with school age children moving into the town. The concern: additional children in the public schools costs the town more than the additional new property tax revenue the Town collects from the new housing.
This post examines this concern, drawing on data from two recent housing developments, representing 283 units of housing in Arlington, to determine that actually the Town budget gains over 4.5 times the actual cost of paying for the students. According to the most recent 2020 tax bills, the Town expects to collect $1,250,370 in revenue and to spend an additional $269,589 for the new Arlington Public School students living in these developments.
The data suggests that the fear of increased school costs, overwhelming the potential new revenue from new housing construction is not warranted.
For more information, see the full post here.