Restrictive covenants are a “list of obligations that purchasers of property must assume … For the first half of the 20th century, one commonplace commitment was a promise never to sell or rent to an African American”. [1] These covenants gained popularity after the Supreme Court’s 1917 decision in Buchanan v. Warley.
Rothstein’s book The Color of Law mentions examples from Brookline, MA; Arlington, MA has examples of it’s own. We’ll look at one from an East Arlington deed dating to 1923. Credit to Christopher Sacca for finding these documents.
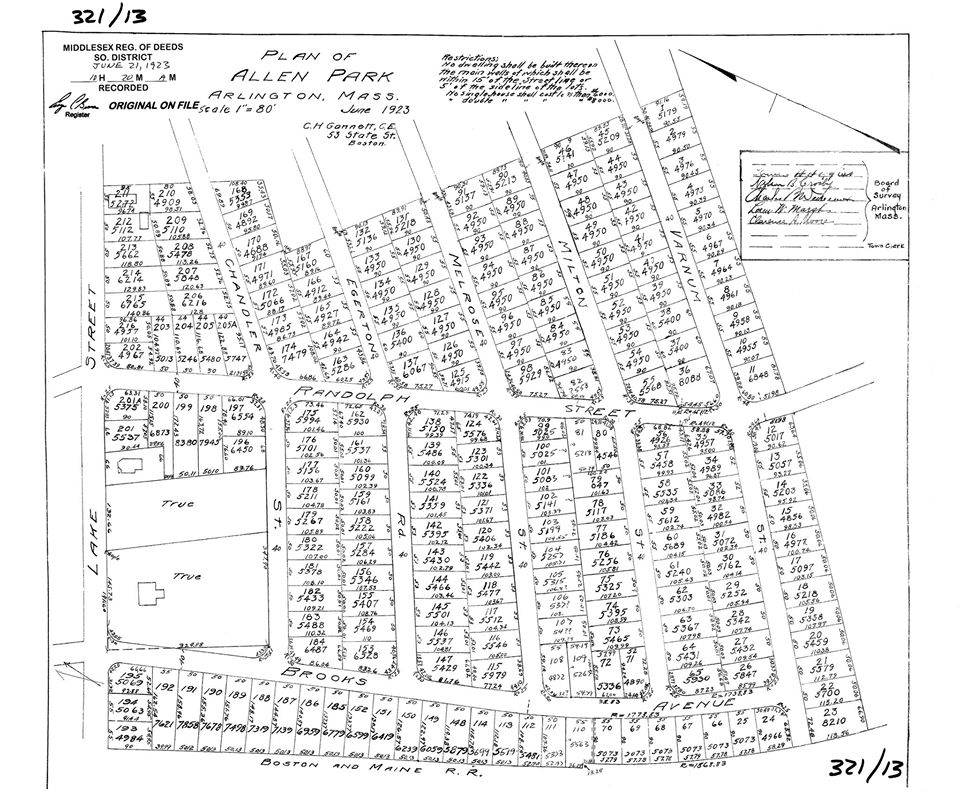
First, a land plan to establish content. Below is the subdivision plan for a farm owned by Herbert and Margaret Allen. I count a little over 200 lots in this subdivision. The plan itself states that “no single house shall cost less than $6,000 and no double house shall
cost less than $8,000″. This language also appears in the property deed.
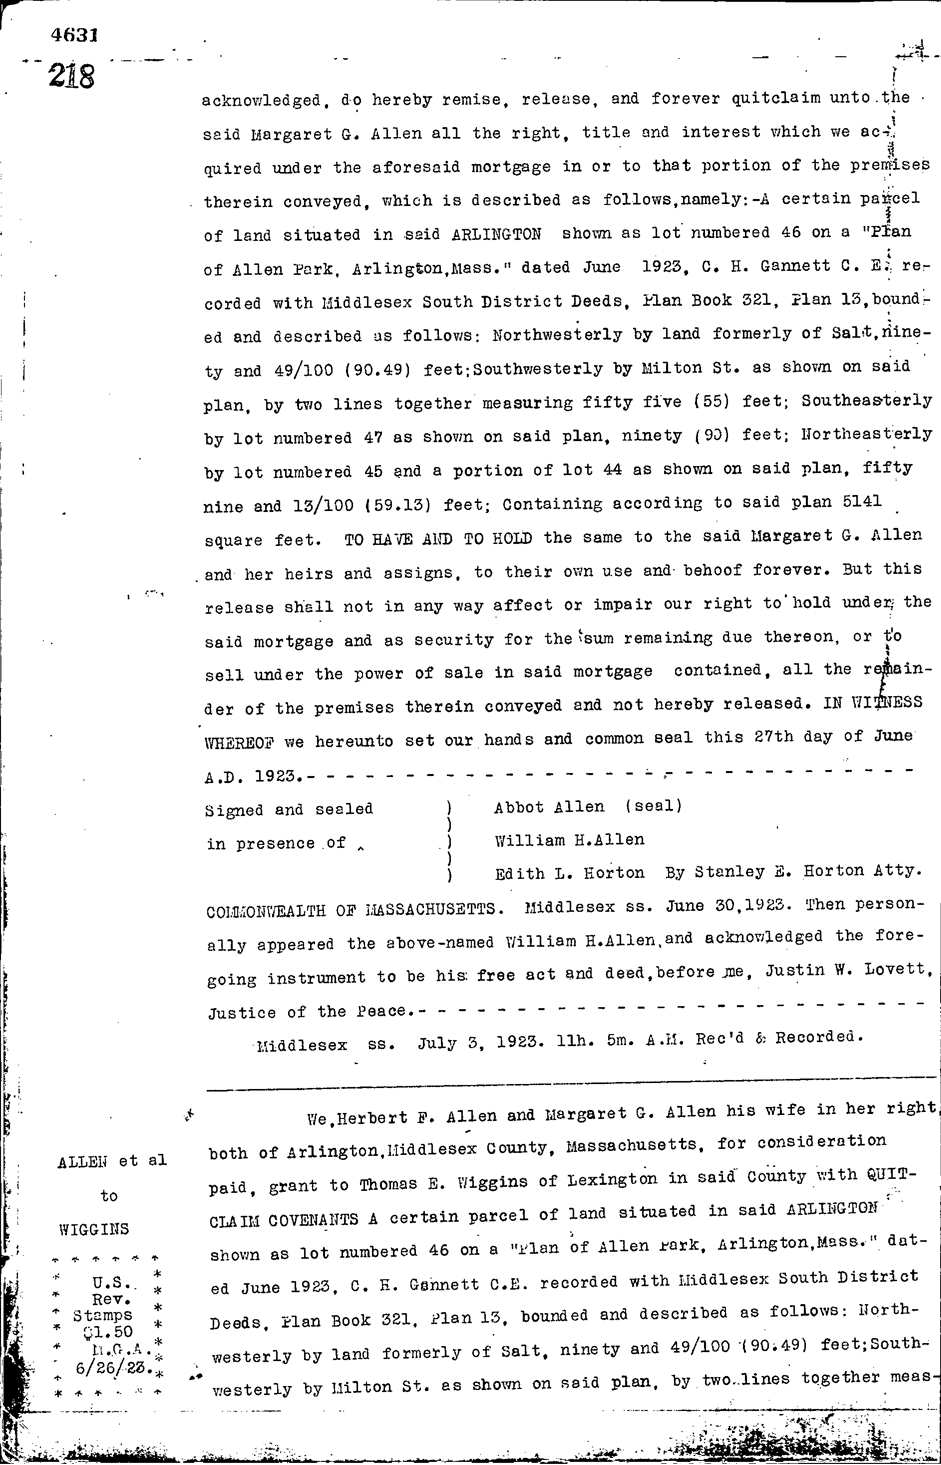
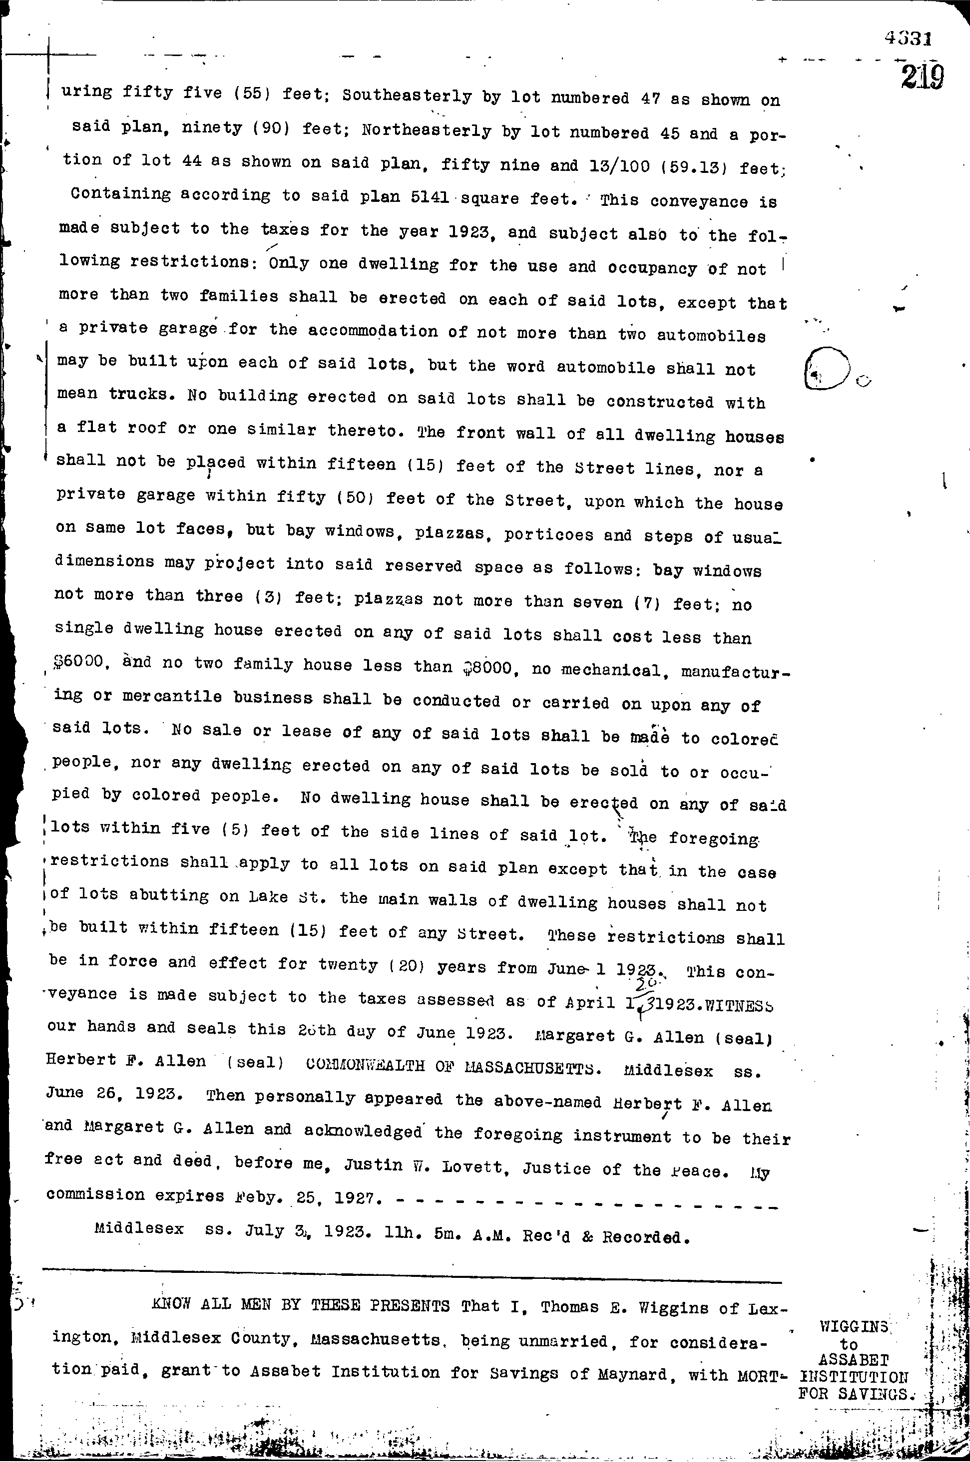
One of the deeds from these parcels appears in book 4631 page 218 and book 4631 page 219, in the Southern Middlesex registry of deeds.
Here’s page 218; the deed begins at the bottom.
Here’s page 219. The racial covenant appears halfway down the page. It reads “No sale or lease of any said lots shall be made to colored people, no any dwelling on any said lots be sold or occupied by colored people”.
The 1920’s were a time of significant residential growth in Arlington, as farmers (called “Market Gardeners” at the time) subdivided and sold off their land. This example shows that Arlington, MA landowners employed some of the same discriminatory tactics for segregation as other communities in the United States. It would take further research to determine how common the use of such covenants was early twentieth-century Arlington.
[1] The Color of Law. Richard Rothstein. pg. 78
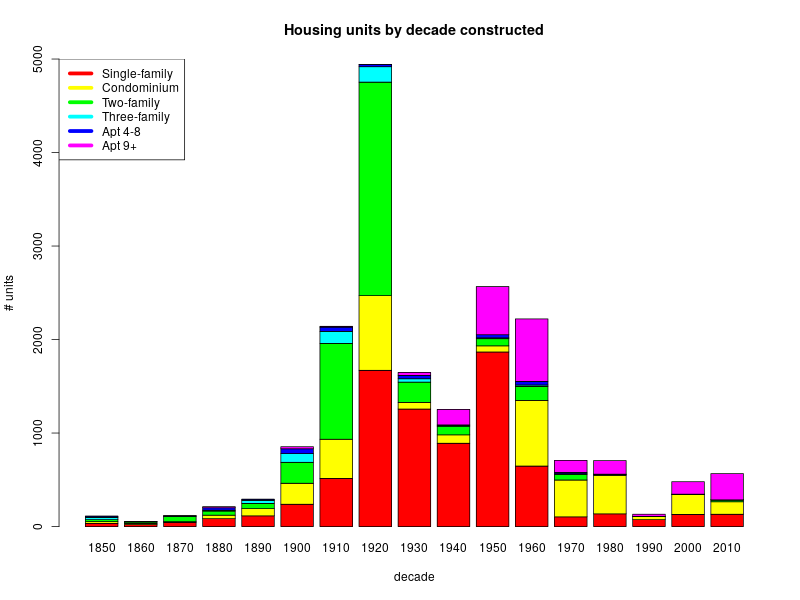
The material in this post came from my efforts to learn about when Arlington’s housing was built. The data comes from the town’s 2019 property tax assessments, where I took our nineteen-thousand-and-some-odd homes and apartments and broke them down by housing type and decade built. It’s not exactly a history housing of production, though it is a close approximation. In this analysis, a single-family home built in the 1912 and rebuilt as a two-family in 1976 would show up as two units built in the 1970s. Similarly, a three-family home that was built in the 1924 and later converted to condominiums would show up as three condominiums built in the 1920s.
Here’s the visual summary:
And here’s a small spreadsheet with the underlying numbers.
My first surprise was at how much we built in the 1920s: just under five thousand units. This was our biggest decade for housing production, and nearly double our second biggest (the 1950s). Another surprise was the 1990s; 132 of our homes were constructed during that decade, which is the smallest number since the 1870s.
What about homes constructed before 1850? There are only 117 of them, and they’re omitted from the data set. I’ve also omitted residential units in mixed-use buildings, since my copy of the assessors data doesn’t break mixed-use buildings into residential and non-residential units.
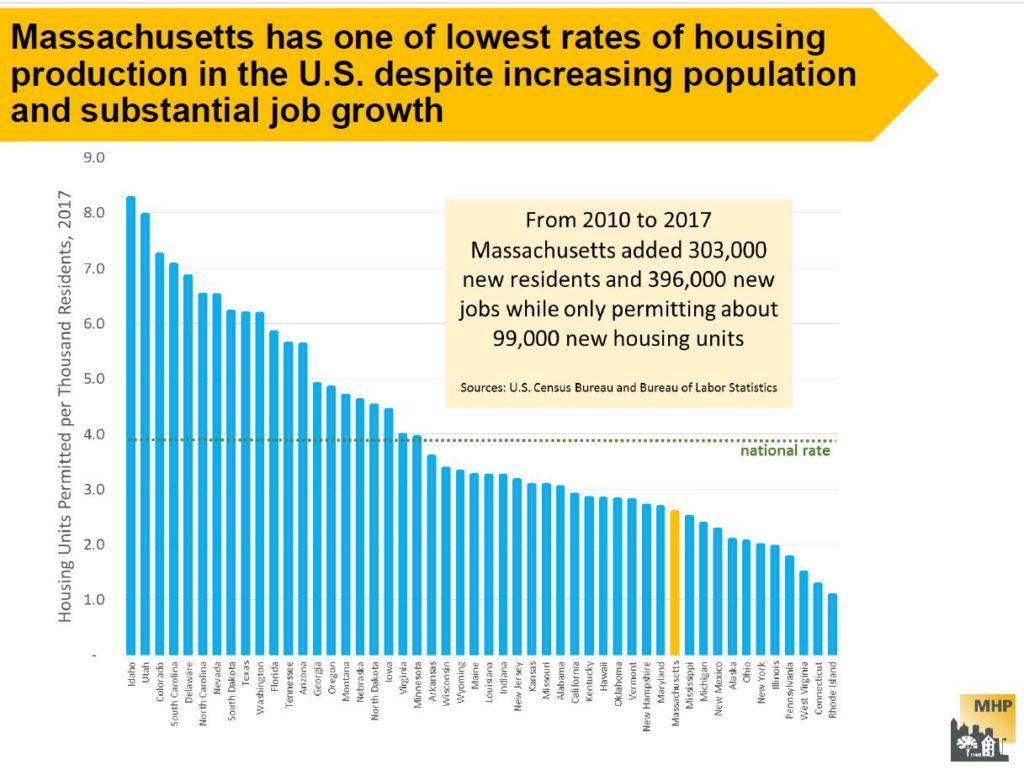
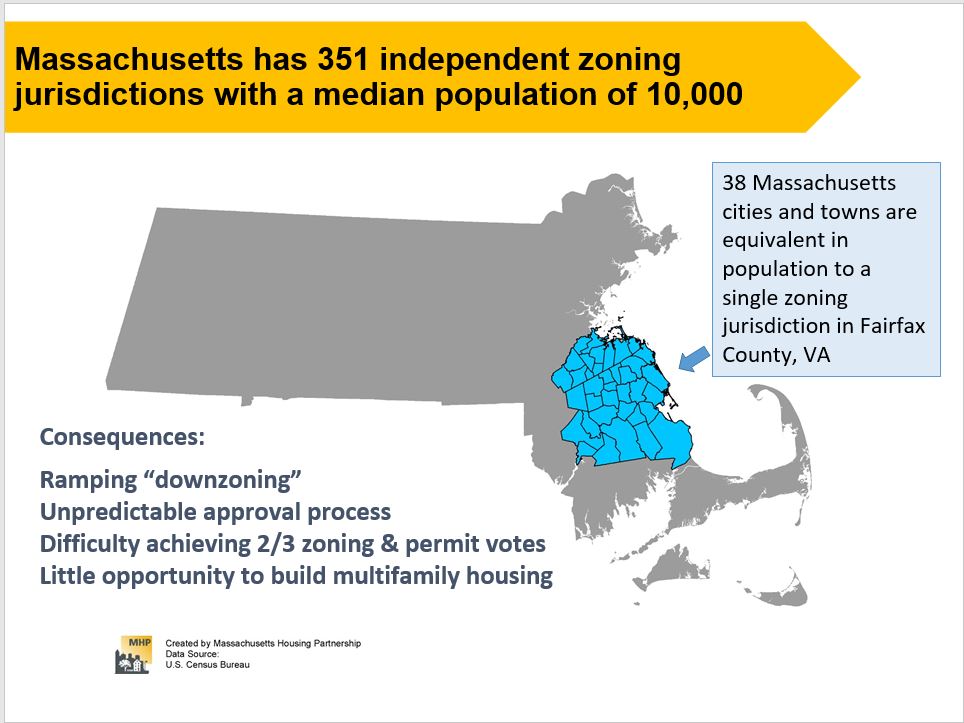
Data in a Mass Housing Partnership report shows how far behind the Boston metropolitan area has fallen in meeting the housing needs of its citizens. There are four primary categories for measuring the inadequacies: 1. Availability, 2. Affordability, 3. L0cation and Mobility and 4. Equitability. See the full report for more data and examples. Two slides are shown below.