This 102 page document is the most recently revised set of recommendations by the Town of Arlington’s Redevelopment Board. The report takes into consideration the comments and information provided over the last few months’ public hearing process. It also incorporates a citizen petition which strengthens the case for increasing permanent affordable housing with the passage of these zoning related Articles. Town Meeting convenes on April 22, 2019.
Related articles
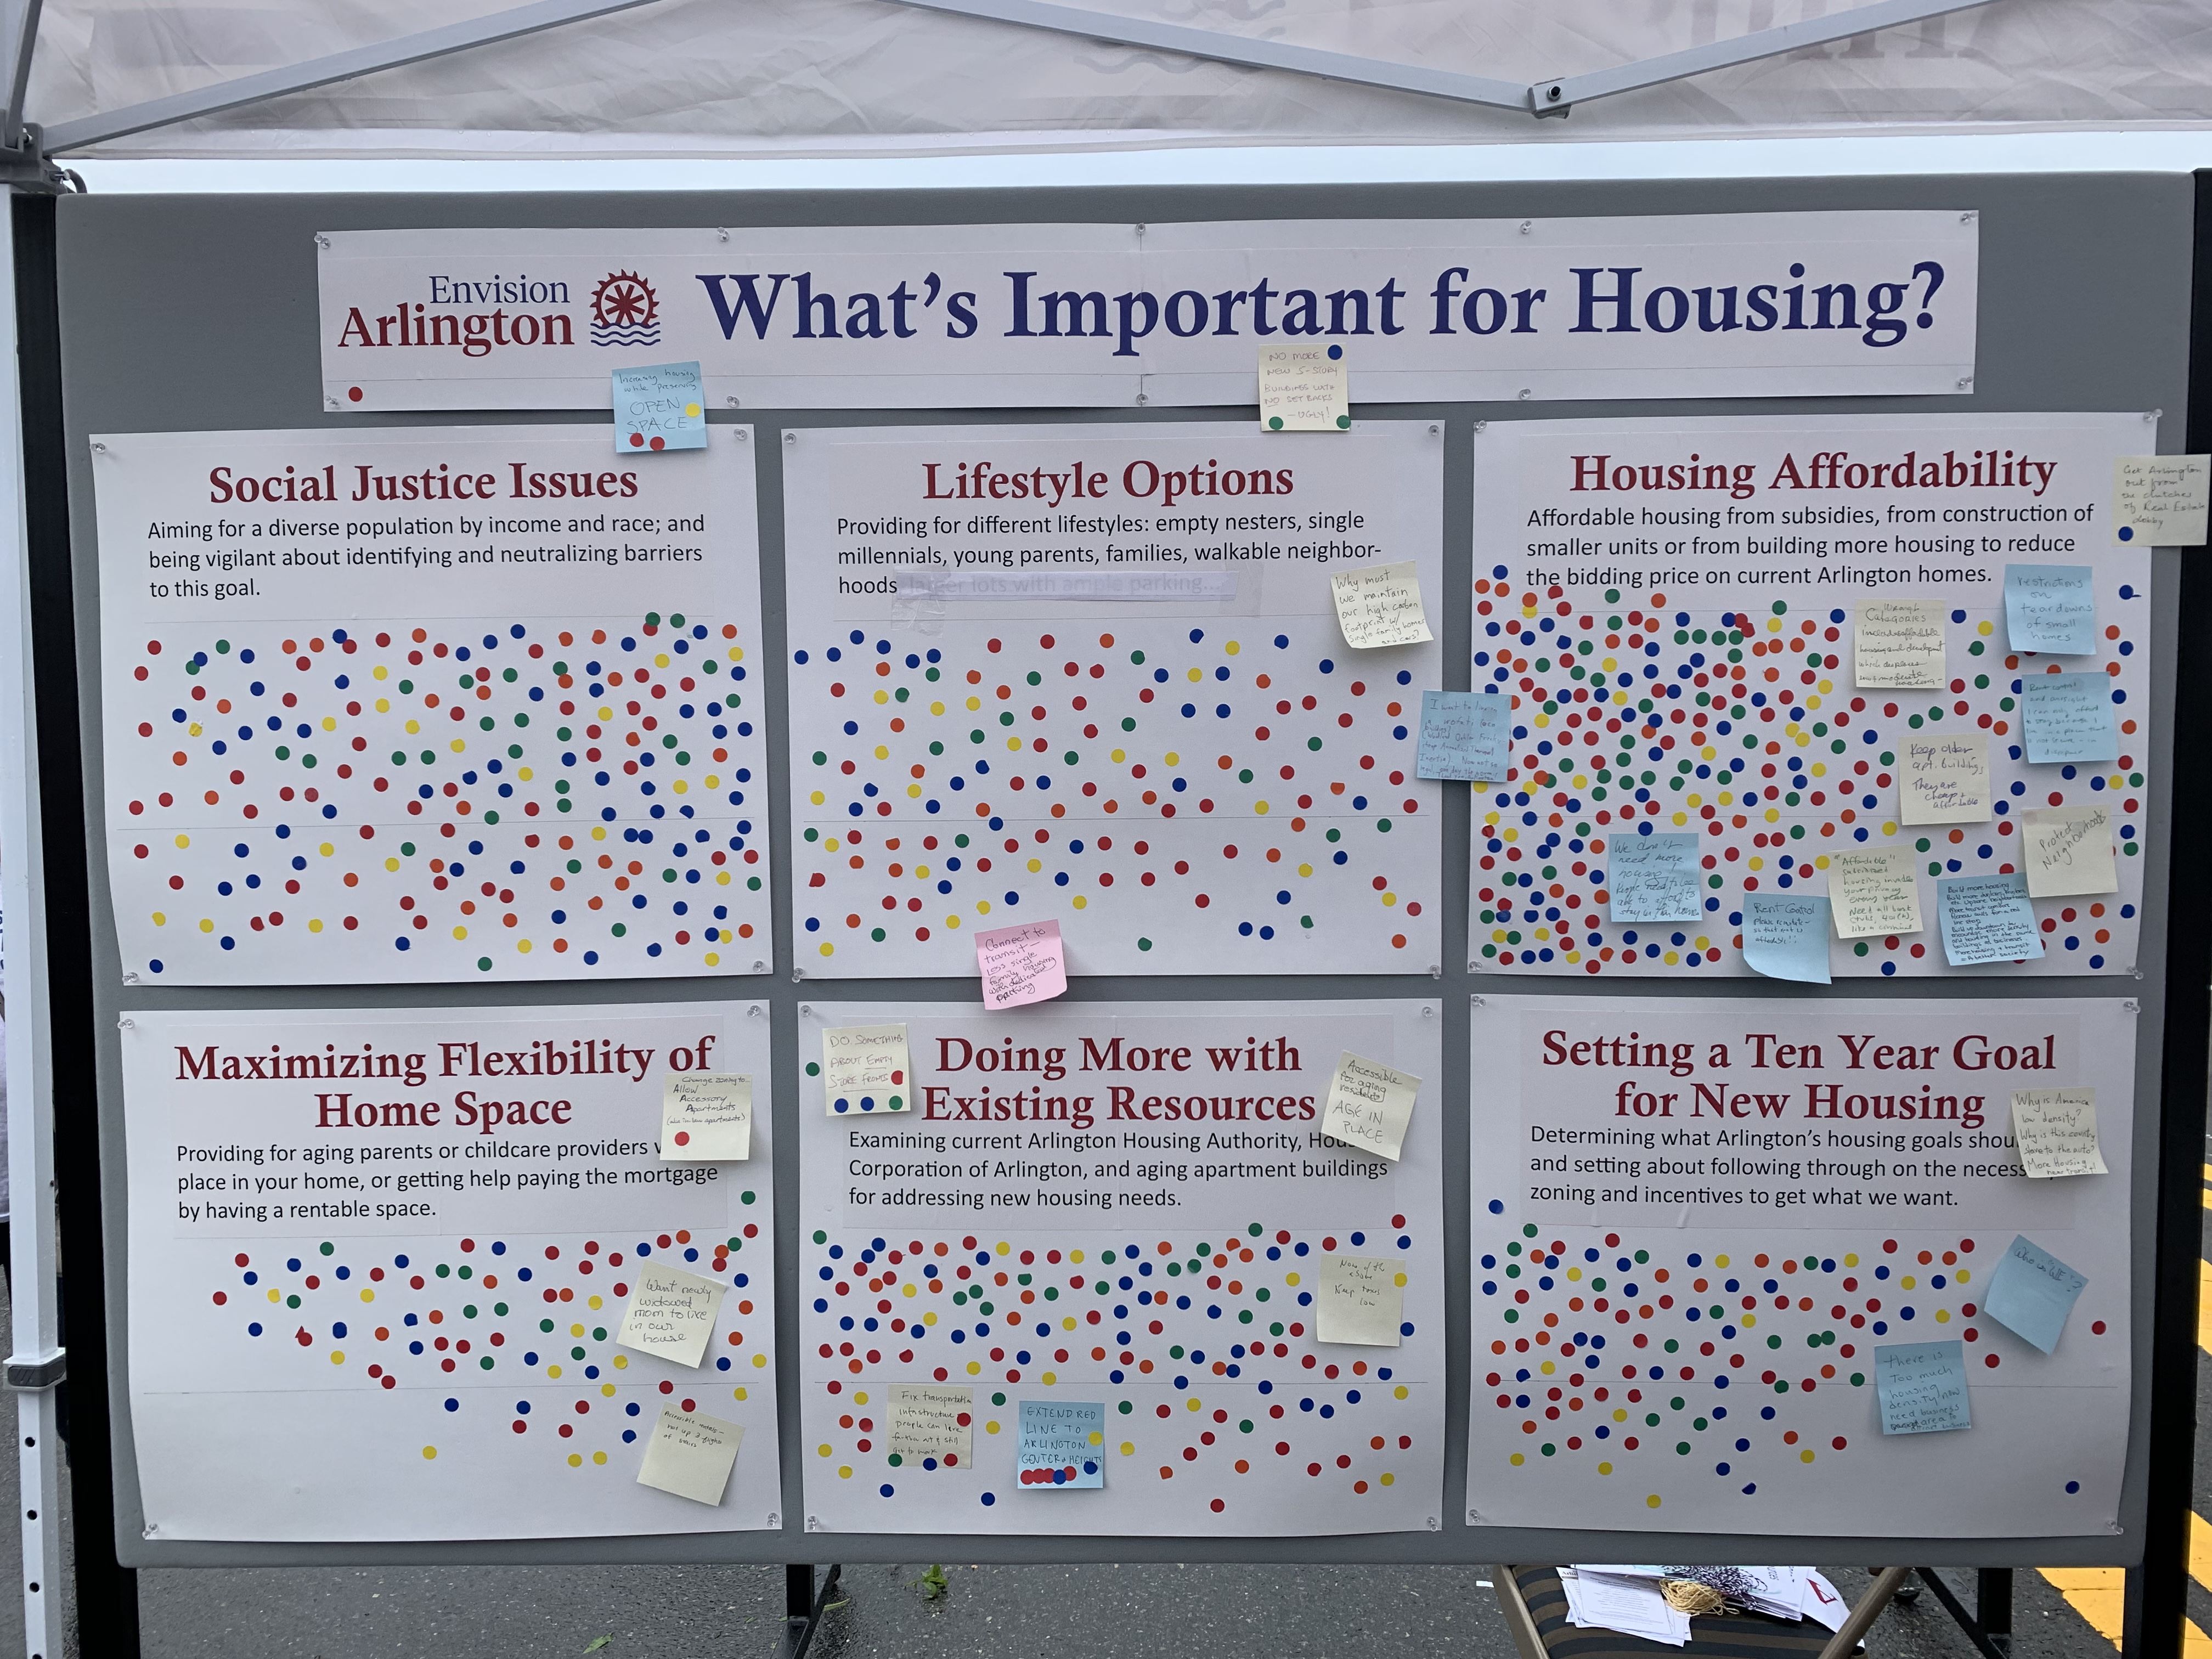
A portion of Envision Arlington’s town day booth was designed to spark a community conversation about housing. Envision set up a display with six poster boards, each representing a housing-related topic. Participants were given three dots and asked to place them on the topics they felt were most important. There were also pens and post-it notes on hand to capture additional comments. This post is a summary of the results. You could think of it as a straw-poll or temperature check on the opinions of town day attendees.
Social Justice Issues
Aiming for a diverse population by income and race; and being vigilant about identifying and neutralizing barriers to this goal.
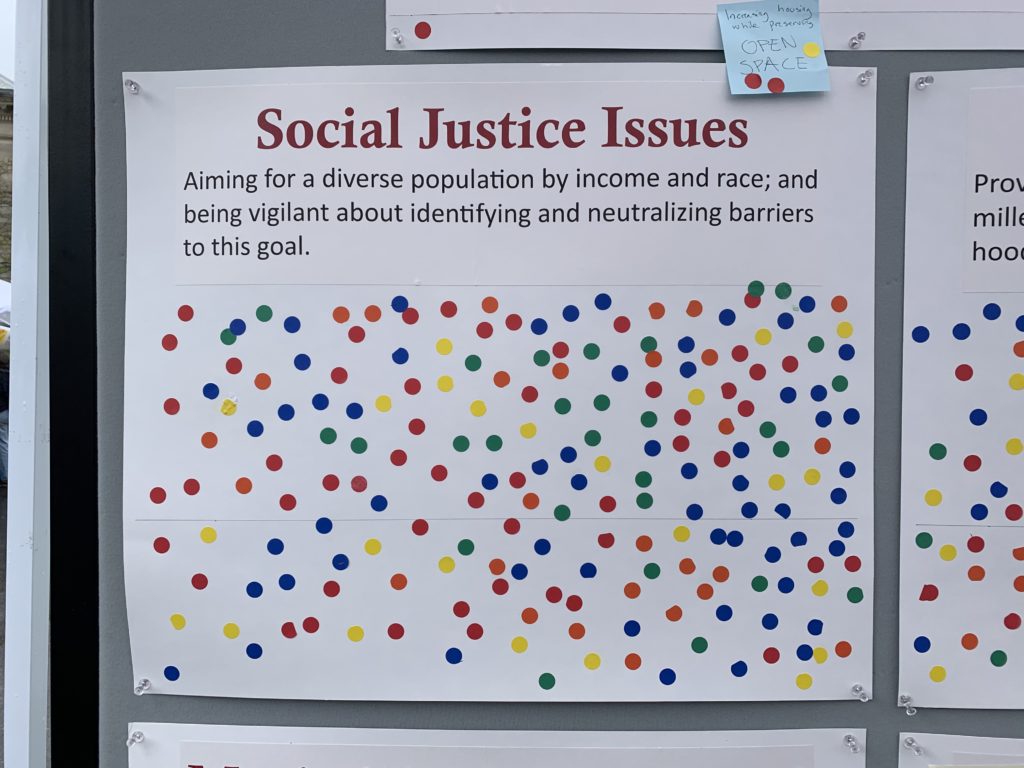
197 dots, plus a post-it note that reads “Increasing housing while preserving open space” (with three dots).
Lifestyle Options
Providing for different lifestyles: empty nesters, single millenials, young parents, families, walkable neighborhoods.
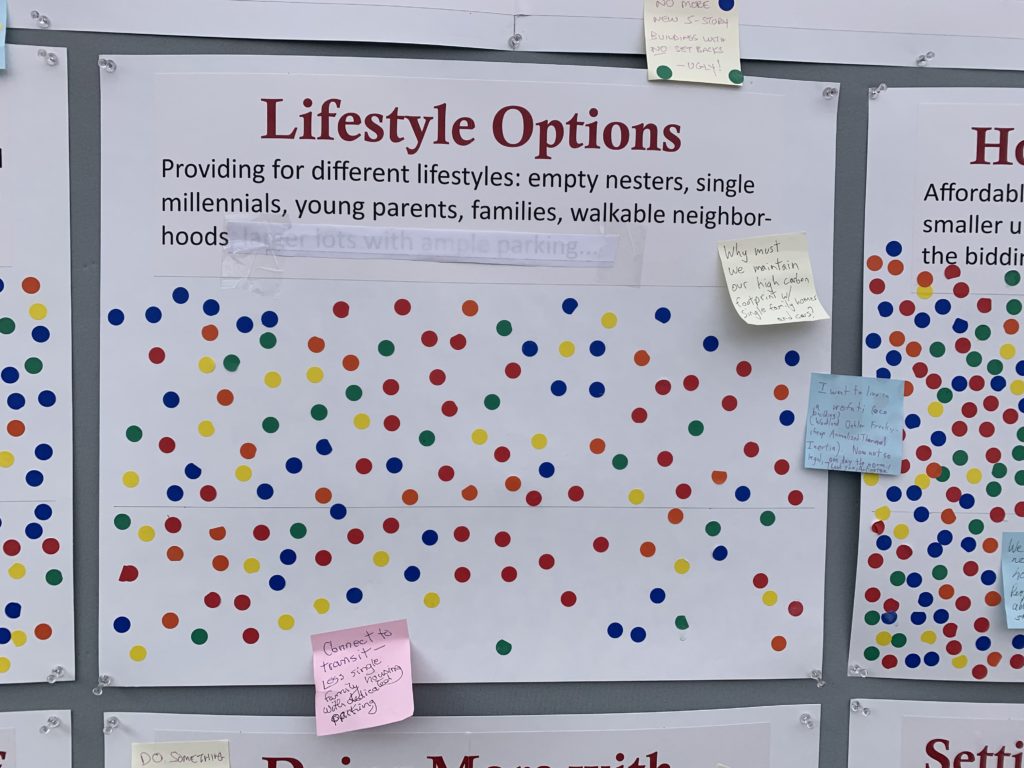
149 dots and four post-it notes:
- No more new 5-story buildings with no setbacks. Ugly. (3 dots)
- Why must we maintain our high carbon footprint with single family homes and cars?
- I want to live in a wofati (eco building) (Woodland Oehler Freak-Cheap Annualized Thermal Intertia). Not so legal, one day the norm. Thank you Arlington.
- Connect to transit. Less single family housing with dedicated parking.
Housing Affordability
Affordable housing from subsidies, from construction of smaller units, or from building more housing to reduce the bidding price on current Arlington homes.
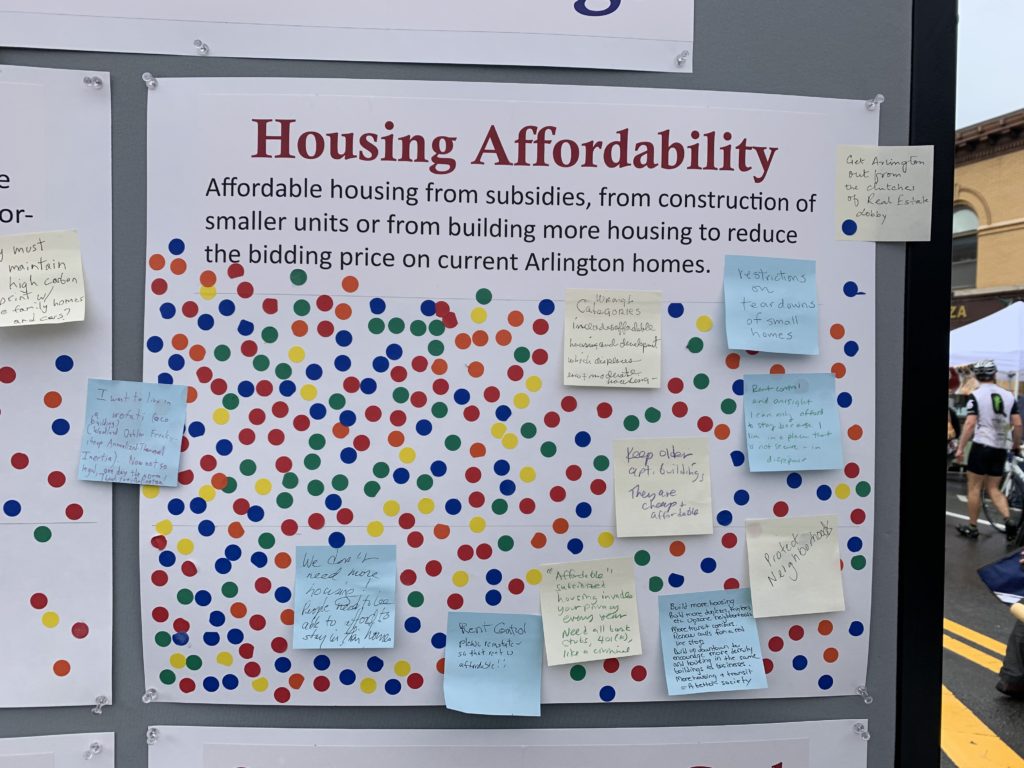
308 dots, with 10 post-it notes
- We don’t need more housing. People need to be able to afford to stay in their homes.
- Get Arlington out from the clutches of real estate lobby. (1 dot)
- Wrong categories. Includes affordable housing and development which displaces low and moderate income housing
- Restrictions on teardowns of small homes
- Keep older apartment buildings. They are cheap and affordable.
- Rent control and oversight. “I can only afford to stay because I live in a place that is not secure and in disrepair.”
- Rent control. Please reinstate so that rent is affordable.
- “Affordable” subsidized housing invades your privacy. Every year need all bank stubs, 401(k), like a criminal.
- Build more housing. Build more duplexes, triplexes, etc. Upzone neighborhoods. More transit corridors. Renew calls for a red line stop. Build up the downtown to encourage more density and housing in the same buildings as businesses. More housing + transit = a better society.
- Protect neighborhoods
This was clearly the topic that drew the most response. Arlington housing is expensive.
Maximizing Flexibility of Home Space
Providing for aging parents or childcare providers with a place in your home or getting help paying the mortgage by having a rentable space.
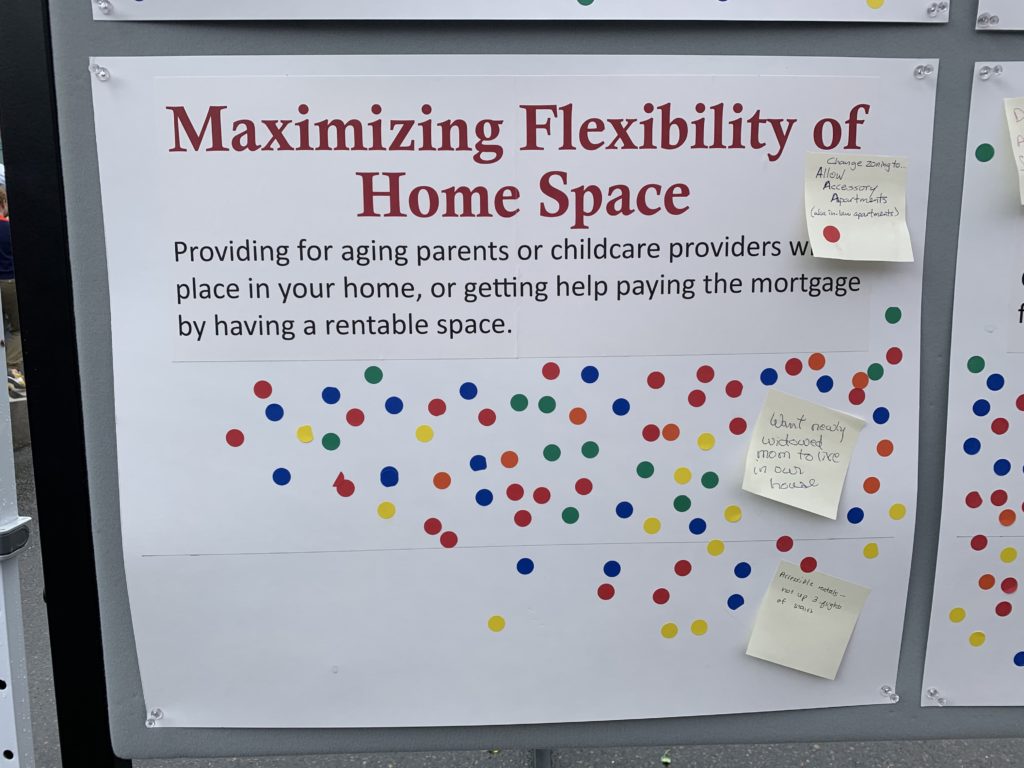
81 dots, and three post-it notes:
- Change zoning to allow accessory dwelling apartments (aka ADUs, granny flats, in-law apartments) (1 dot)
- Want nearby widowed mom to live in own house.
- Accessible rentals, not up 3 flights of stairs.
Doing more with Existing Resources
Examining current Arlington Housing Authority, Housing Corporation of Arlington, and aging apartment buildings for addressing new housing needs.
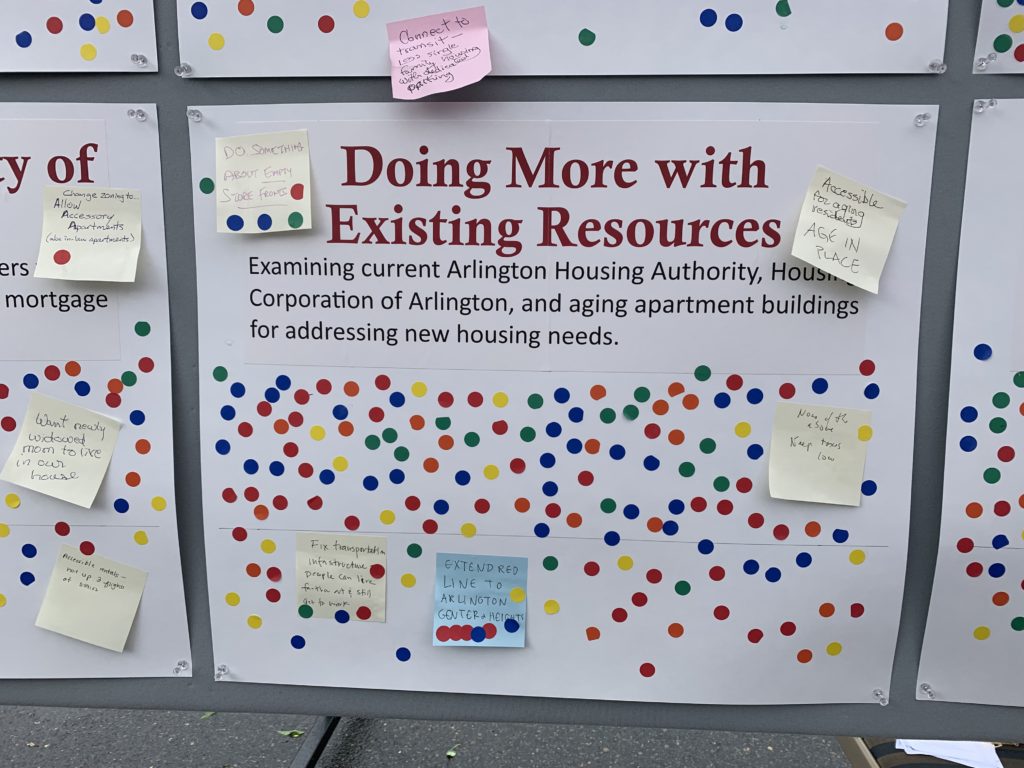
143 dots, and five post-it notes:
- Fix transportation infrastructure. Peope can live farther out and still get to work. (4 dots)
- Extend red line to Arlington center and heights. (7 dots)
- None of the above. Keep taxes low. (1 dot)
- Accessible for aging residents. Age in place.
- Do something about empty store fronts.
Setting a ten-year goal for new housing
Determining what Arlington’s housing goals should be, and setting about following through on the necessary zoning and incentives to get what we want.
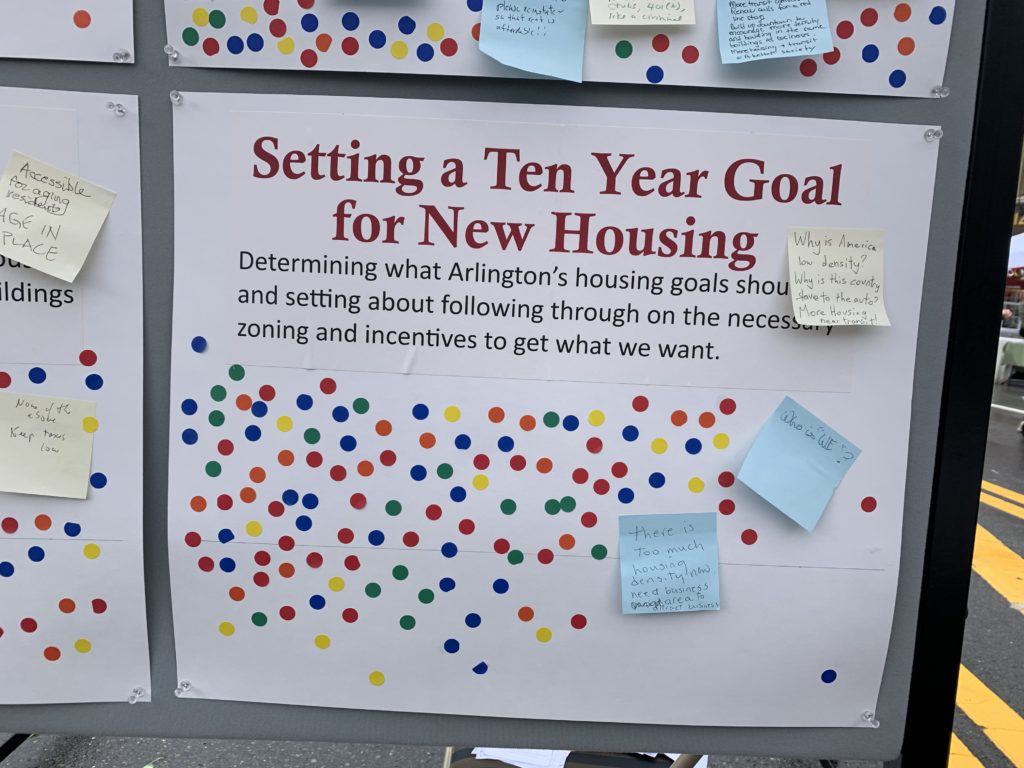
119 dots, and three sticky notes:
- Why is America low-density? Why is this country slave to the auto? More housing near transit!
- Who is “we”?
- There is too much housing density now. Need business area to attract business.
Observations
As noted earlier, the cost of housing seemed to be the main issue of concern. This is understandable: housing prices in Arlington (and the region in general) have been on an escalator ride up since about 2000 or so. That’s led to our current high cost of housing, and also to a form of gradual gentrification. When housing is more expensive than it was last year, a new resident in town has to make more money (or be willing to spend more on housing) than last year’s new resident.
I see at least two broad responses to this: one is to keep the status quo, perhaps returning to the inexpensive housing of decades past. The other is for more multi-family housing, and more transit-oriented development. It will be interesting to see how these dynamics play out in the future.
There’s also recognition of the importance of older “naturally affordable” apartment buildings. Arlington was very pro-growth in the 1950s and 1960s; that’s fortunate, because it allowed these apartments to be built in the first place. On the downside, we haven’t done a good job of allowing new construction into the pipeline during recent decades. Buildings depreciate, so a new building is worth more than one that’s ten years old, which is worth more than one that’s twenty years old, and so on. At some point, the old apartments are likely to be refurbished/upgraded, and they’ll become more expensive as a result.
This is only the beginning of the conversation, but at least we’re getting it going.
Restrictive covenants are a “list of obligations that purchasers of property must assume … For the first half of the 20th century, one commonplace commitment was a promise never to sell or rent to an African American”. [1] These covenants gained popularity after the Supreme Court’s 1917 decision in Buchanan v. Warley.
Rothstein’s book The Color of Law mentions examples from Brookline, MA; Arlington, MA has examples of it’s own. We’ll look at one from an East Arlington deed dating to 1923. Credit to Christopher Sacca for finding these documents.
First, a land plan to establish content. Below is the subdivision plan for a farm owned by Herbert and Margaret Allen. I count a little over 200 lots in this subdivision. The plan itself states that “no single house shall cost less than $6,000 and no double house shall
cost less than $8,000″. This language also appears in the property deed.
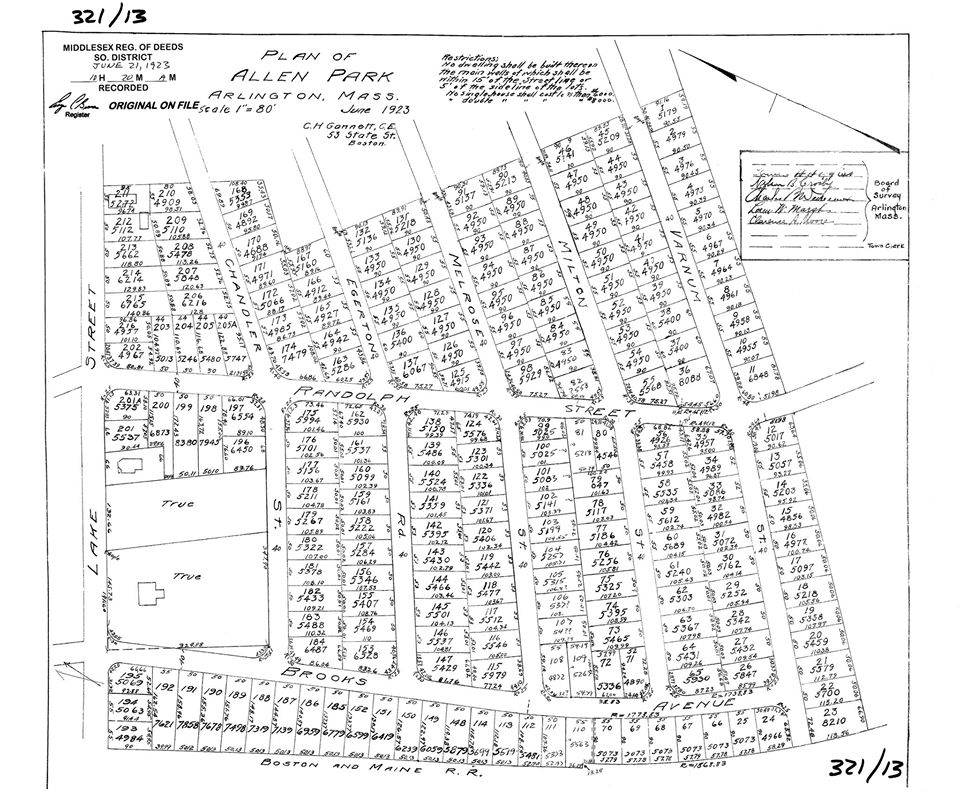
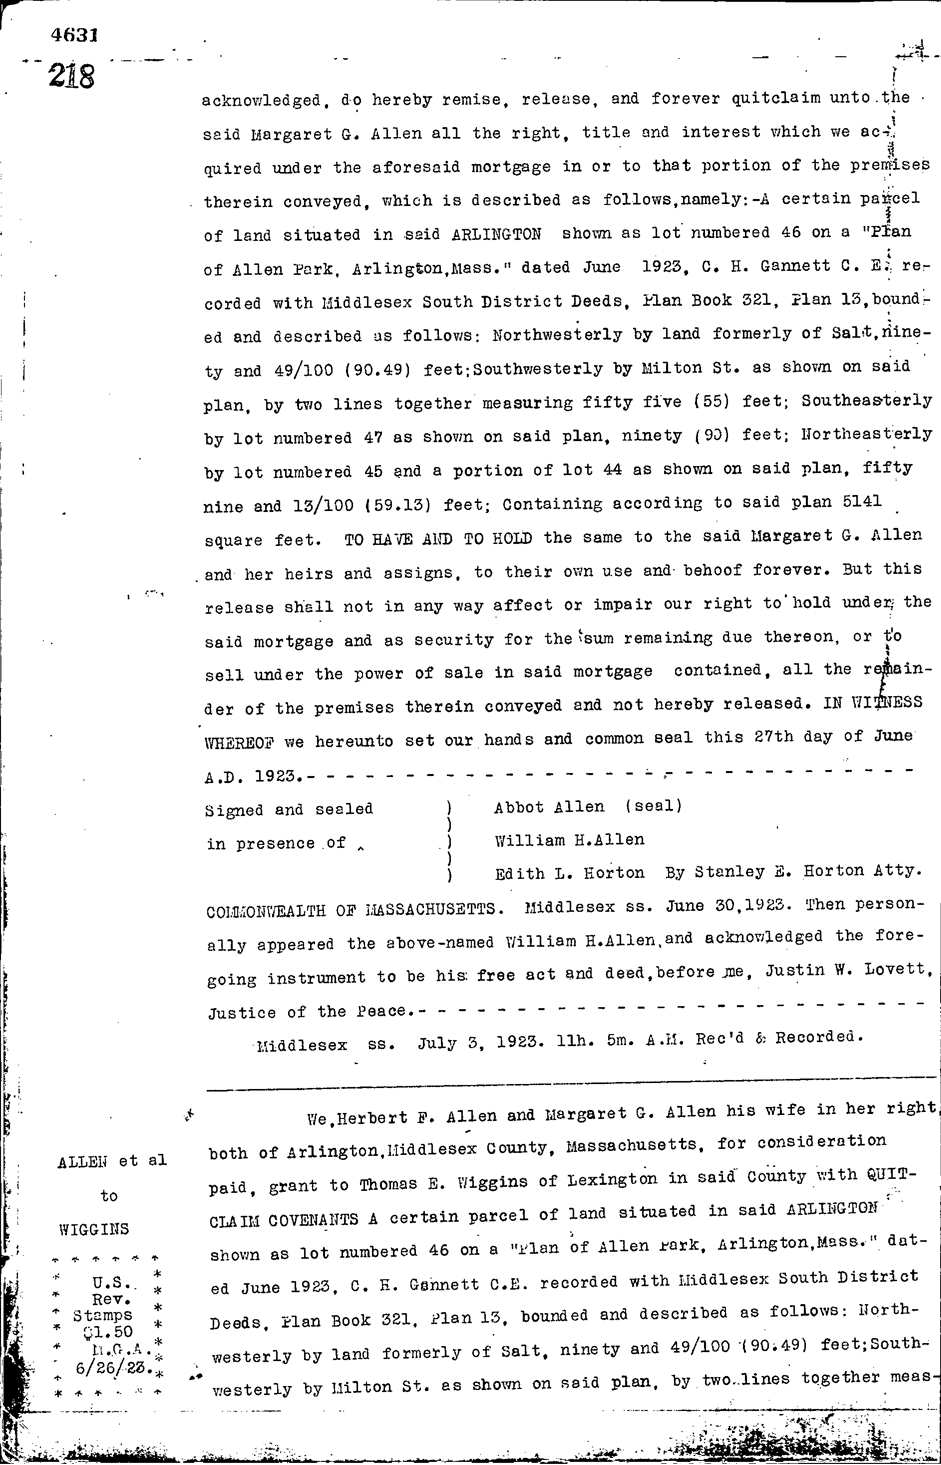
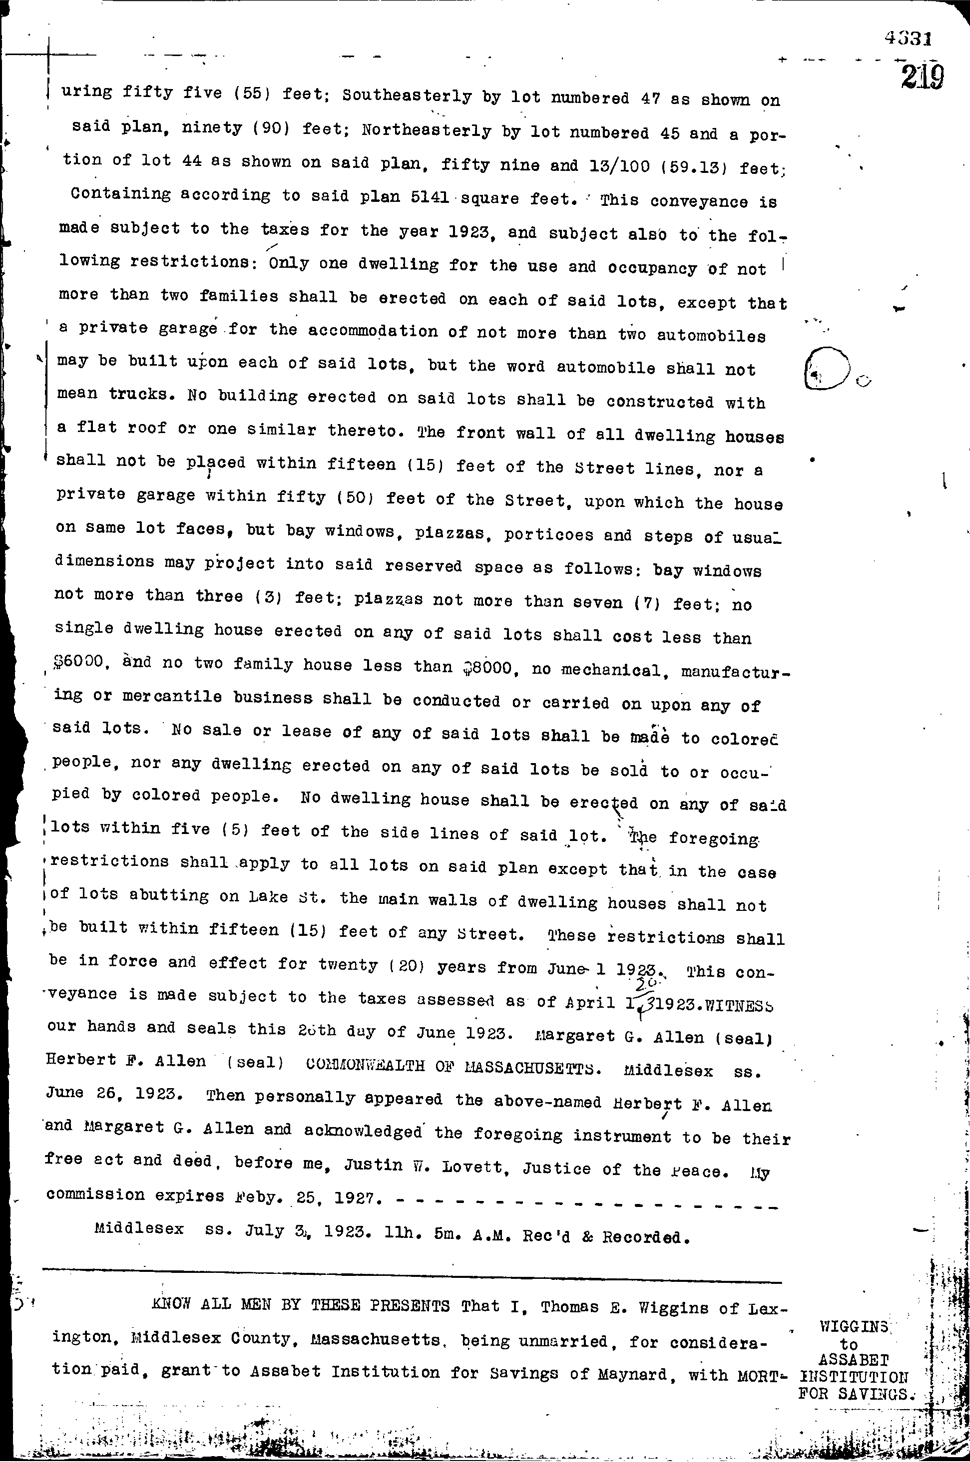
One of the deeds from these parcels appears in book 4631 page 218 and book 4631 page 219, in the Southern Middlesex registry of deeds.
Here’s page 218; the deed begins at the bottom.
Here’s page 219. The racial covenant appears halfway down the page. It reads “No sale or lease of any said lots shall be made to colored people, no any dwelling on any said lots be sold or occupied by colored people”.
The 1920’s were a time of significant residential growth in Arlington, as farmers (called “Market Gardeners” at the time) subdivided and sold off their land. This example shows that Arlington, MA landowners employed some of the same discriminatory tactics for segregation as other communities in the United States. It would take further research to determine how common the use of such covenants was early twentieth-century Arlington.
Footnotes
[1] The Color of Law. Richard Rothstein. pg. 78

Massachusetts is experiencing a housing affordability crisis and a climate crisis. For these reasons, Mothers Out Front Arlington supports changes in zoning by-laws that allow greater density in housing near public transit. Mothers Out Front is supportive of the passage of a meaningful MBTA Communities Act that encourages the development of more multi-family housing and a greater diversity of home types in Arlington. A revised zoning by-law to allow for more multi-family housing will reduce pressure to build single family homes on undeveloped land elsewhere in Massachusetts. This safeguards undisturbed ecosystems and provides real alternatives to automotive commutes in the region, reducing both congestion and fossil fuel emissions. In addition, passing this by-law will allow Arlington to participate in the Massachusetts pilot for communities to build fossil fuel-free homes, thus ensuring that new construction in Arlington supports our net-zero climate goals.
Mothers Out Front Arlington respects the public engagement activities that inform the Working Group’s MBTA Communities Act proposal. We appreciate that the Working Group is working with the Town to identify opportunities for developer incentives to encourage public open spaces, mitigate heat islands, and increase the tree canopy. Similarly, the Town’s commitment to maintaining current (and incentivizing higher) zoning requirements for affordable housing also is important to our group. For these reasons, Mothers Out Front Arlington strongly urges the Arlington Redevelopment Board to accept the MBTA Communities Act plan as proposed by the Working Group.

Prepared by: Barbara Thornton with the capable assistance of Alex Bagnall, Pamela Hallett, Patrick Hanlon, Karen Kelleher, Steve Revilak and Jennifer Susse.
As Arlington considers new zoning and other policy decisions to increase the amount of affordable housing in the town, a concern has been raised about the threat of greater costs to the Town’s budget from new people with school age children moving into the town. The concern: additional children in the public schools costs the town more than the additional new property tax revenue the Town collects from the new housing.
This post examines this concern, drawing on data from two recent housing developments, representing 283 units of housing in Arlington, to determine that actually the Town budget gains over 4.5 times the actual cost of paying for the students. According to the most recent 2020 tax bills, the Town expects to collect $1,250,370 in revenue and to spend an additional $269,589 for the new Arlington Public School students living in these developments.
The data suggests that the fear of increased school costs, overwhelming the potential new revenue from new housing construction is not warranted.
For more information, see the full post here.

(by Steve Revilak)
In 2021 the Massachusetts State Legislature passed the MBTA Communities act, which requires cities and towns served by the MBTA (aka “MBTA Communities”) to create districts where multi-family housing can be built by-right, without a disretionary approval process. The law was intended to help address the Commonwealth’s housing shortage, and to encourage more transit-oriented development. Building housing near transit and walkable areas has a lot of environmental benefits; it let’s people take trips without driving, lessens congestions, and cuts down on greenhouse gas emissions. It’s a solid strategey.
Arlington created its multi-family districts in the fall of 2023 and the Attorney General’s office approved them in June 2024. The laws have been on the books for just over a year — what kind of a difference are they making in Arlington?
2024 was a slow year for the MBTA Communities act in Arlington; there was one application which turned a two-family home on Belknap St into a pair of two-family homes, for a net change of two additional dwellings. 2025 has brought more activity. There are four applications under the review by the Arlington Redevelopment Board but none have been approved yet. These are:
- 225 Broadway, to convert a two-family home into a four-family,
- 126 Broadway, to convert a two-family home into a mixed use building with space for a business on the first floor, and 14 apartments,
- 18 Grafton, to convert a one-family home into a four-family, and
- 9-11 Robbins Road to convert a two-family home to nine apartments
There was an additional application to convert four apartments to five at 259 Broadway, but the applicant withdrew after their first hearing.
If all of these projects are approved, the net change will be an additional 26 homes, which represents a 0.1% increase relative to the 20,460 dwellings that Arlington had as of the 2020 census. It’s been a very slow trickle.
The MBTA Communities act was a meaningful reform which is just starting to make a difference. It’s bringing proposals for smaller multi-family homes that used to be the mainstay of our housing stock, but are generally rare today. However, the MBTA Communities Act is only one tool and Massachusetts will have to do more in order to build the 222,000 homes we need.
Dave Weinstock, an Arlington resident interested in affordable housing wondered about the concept of “developer math”. The math involved in planning an affordable housing projects is a problem that needs to get solved in order to have anything built here in Arlington, or anywhere. This topic comes up frequently in community discussions about the need for more housing.
Questions are raised around:
- 1- Why build so many units vs. smaller buildings
- 2- Why parking is costly and inefficient use of land
- 3- Why can’t more affordable or all affordable units be built?
- 4- The cost of subsidizing affordable units and how that may translate to higher rental rates/costs, etc.
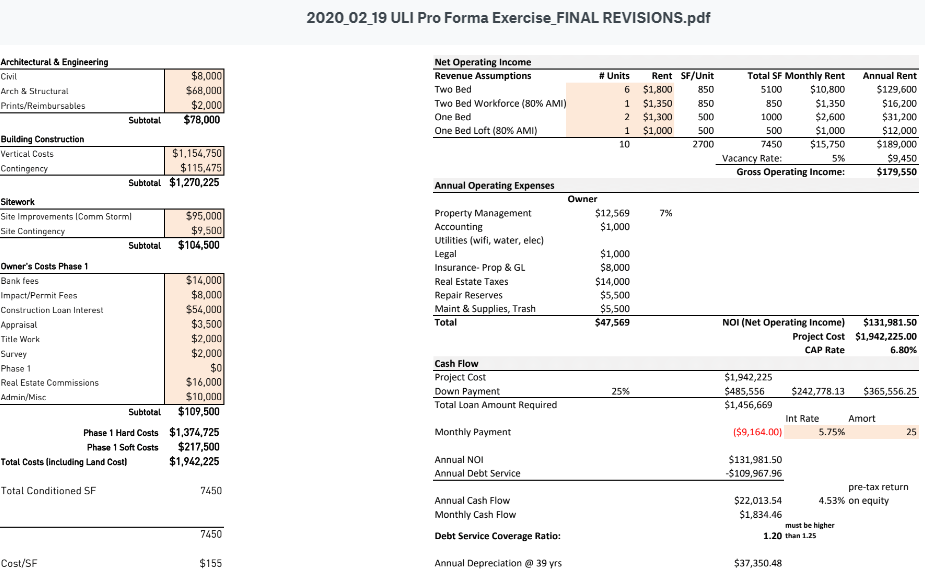
Dave found a great Architecture and Development firm in Atlanta (Kronberg Urbanists + Architects, based in Atlanta GA) that lays out a nice presentation, includes sample proformas, and real life scenarios that may help us understand this piece of the puzzle better when evaluating any project and how developers may be incented to build certain types of projects or do certain types of work.
Here is a link, reformatted to be within this website, to the presentation, showing the varieties of choices, costs, formulas and outcomes developers consider before deciding if the project can be built: https://equitable-arlington.org/developer-math_kua_071420/
Much of our hope for more affordable housing depends on the market forces of capitalism and the willingness of developers to build for good, not just for profit. But the developers must be able to cover their costs. Many communities are highly skeptical of developers, assuming the community will get tricked, the developer will get greedy and the promised housing will be a disappointment. Trust is needed. But so is verification. We all need to learn the developer math.
What are the math factors that a developer considers before deciding to build affordable housing?
Here is a link to the original presentation. https://www.kronbergua.com/post/mr-mu-let-s-talk-about-math