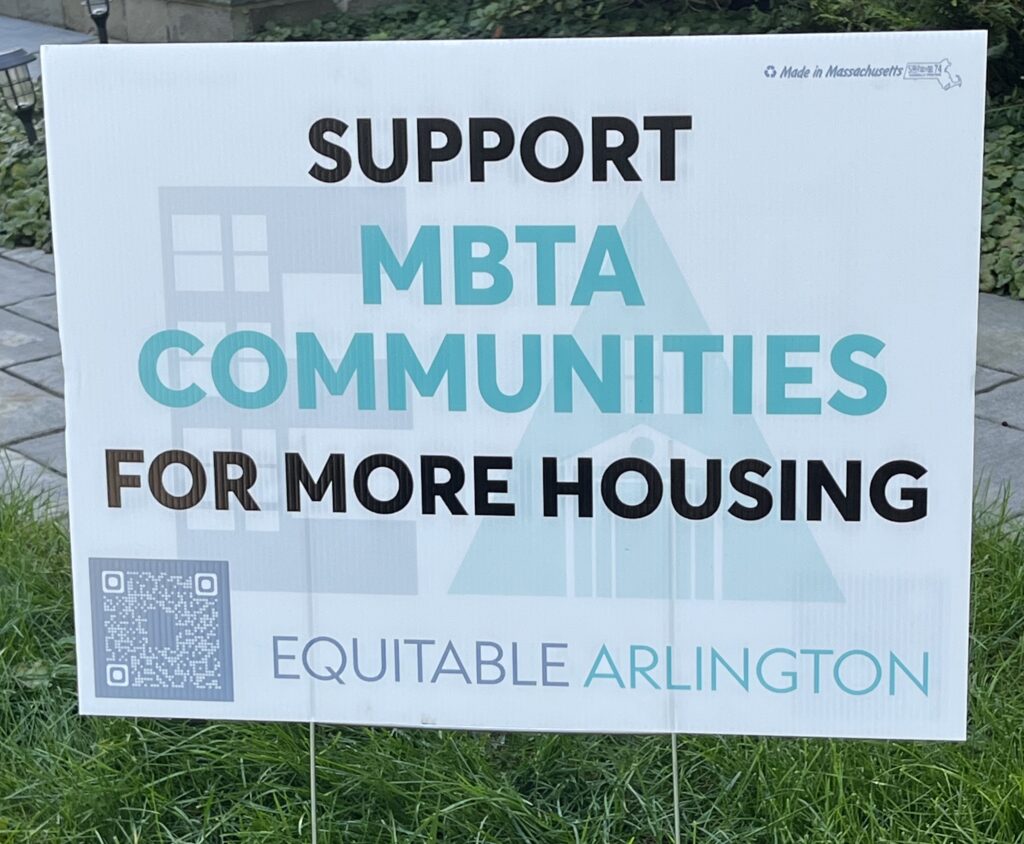
Show you support the MBTA Communities Plan for Arlington with this free yard sign. Sign up below with your name and address, and we will deliver the yard sign to your home and place it in your front yard for you! If you don’t have access to a yard, we can also give you one to place in your window.
Related articles
For Arlington’s Nov 2020 Special Town Meeting, my colleague Ben Rudick filed the following warrant article:
ARTICLE 18: ZONING BYLAW AMENDMENT/IMPROVING RESIDENTIAL INCLUSIVENESS, SUSTAINABILITY, AND AFFORDABILITY BY ENDING SINGLE FAMILY ZONING
To see if the Town will vote to amend the Zoning Bylaw for the Town of Arlington by expanding the set of allowed residential uses in the R0 and R1 zoning districts with the goal of expanding and diversifying the housing stock by altering the district definitions for the R0 and R1 zoning districts; or take any action related thereto.
(Inserted at the request of Benjamin Rudick and ten registered voters)
The Inspiration
Our goal with Article 18 is to allow two-family homes, by right, in two districts that are exclusively zoned for single-family homes. This is similar to what city of Minneapolis and the state of Oregon did in 2019. The motivations fall into three broad categories: the history of single-family zoning as a mechanism for racial segregation, environmental concerns arising from car-oriented suburban sprawl, and the regional shortage of housing and its high cost. We’ll elaborate on these concerns in the following paragraphs, and end with a proposed main motion.
Single-family zoning as a mechanism for racial segregation. Single-family zoning began to take hold in the United States during the 1920’s, after the Supreme Court declared racially-based zoning unconstitutional in 1917. Secretary of Commerce Herbert Hoover encouraged cities and towns to adopt single-family zoning ordinances, effectively substituting segregation based on race with segregation based on economic status. The idea was furthered by the Home Owners Loan Corporation of America’s (HOLC’s) redlining maps (created between 1935 and 1940), and the Federal Housing Administration’s (FHA’s) mortgage insurance policies from 1934–1968. The HOLC designated areas with black populations as “hazardous” and actuarially risky, and the FHA used these maps when making underwriting decisions. In short, the FHA was in the business of underwriting loans to white home buyers in white neighborhoods.
Of Arlington’s 7,998 single-family homes, 4,080 (51%) were built during 1934–1968 (per Arlington Assessor’s data). The FHA was the primary mortgage underwriter during this time, and we believe it is reasonable to expect that a substantial number of these homes were originally purchased with FHA mortgages. Put another way, most of our single-family housing was likely built according to FHA guidelines of “avoiding inharmonious mixing or races”, aka segregation. Arlington’s population was 99% white in 1970 and even higher during previous decades. We certainly met the criteria of being a white community.
We believe it’s important to recognize this history, and to have a conversation about how we might restore a balance of fairness.
Environmental concerns. When compared with their multi-family counterparts, single-family homes are less energy efficient, more land intensive, and are associated with higher carbon emissions due to ransportation. Car transportation is a useful analogy; having everyone drive in their own car is more carbon-intensive than carpooling (two-family homes), which in turn is more carbon-intensive than taking the bus (3+ unit buildings). Maps created by Berkeley’s Cool Climate Project show this in a clear way: per household carbon emissions are lower in urban areas than they are in the surrounding suburbs. (Note that authors of the Berkeley report do not advocate getting rid of suburbs, but they do state that suburbs will require different carbon reduction strategies than urban areas).
We believe it is more environmentally responsible to build additional homes on sites that are already developed, rather than (say) going out to the suburban fringes along route 495 and clearing half-acre lots. If we do not provide ample housing within Arlington and other inner-ring suburbs, new workers will likely live further out and have longer, more carbon-intensive commutes. Climate change is a crisis, and our response must involve changing how we live, and that includes ending the twentieth-century pattern of suburban sprawl.
The shortage and high cost of housing. Since 2010, the fifteen cities and towns in the Metro Mayor’s coalition have added 148,000 jobs and 110,000 new residents, but have only permitted 32,500 new homes; this has added to a housing shortage that’s been growing for decades. The imbalance between supply and demand has contributed to rising prices and a very hot market. In 2019, the median sale price for homes in Arlington was $821k. We do not expect construction to be a complete solution to Arlington’s housing costs, but we do believe it is a necessary step in meeting rising demand and counteracting rising costs.
Article 18 is most likely to influence the cost of newly-constructed homes. Newly-constructed single-family homes typically sell in the $1.2M–1.5M range while condominiums in new duplexes typically fall into the $800k–1.1M range. These duplex units are not cheap, but they offer a price point roughly four hundred thousand dollars less than new single-family homes.
We also believe our proposal directly addresses three concerns raised by last year’s multi-family proposal (aka 2019 ATM Article 16):
- Concentration. Last year’s proposal would have concentrated new housing around the town’s business corridors, and Massachusetts Avenue in particular. Article 18 will spread new housing across the majority of the town, as 60% of Arlington’s land area (and 80% of its residentially-zoned land) is currently zoned exclusively for single-family homes (figures provided by Arlingtons Department of Planning and Community Development).
- Height and Shadows. Last year’s proposal would have allowed taller buildings along the commercial corridors; there were concerns about increased height, and the shadows new buildings might cast. Article 18 makes no changes to our zoning bylaw’s dimensional regulation; homes built under this bylaw could be no larger than homes we already allow, by right.
- Displacement. Last year’s proposal drew concerns that businesses and apartment renters would be displaced by new construction. Article 18 applies to districts that are exclusively zoned for single-family homes. 95% of our single-family homes are owner-occupied, and can only be rebuilt or renovated with the owner’s consent. We believe this minimizes any risk of displacement.
Finally, we expect the board will be interested in the number of homes that might be added under this proposal, and the potential impact on the school system. We’ll attempt to address those questions here.
Arlington’s report on Demolitions and Replacement Homes states an average of 27 rebuilds or substantial renovations per year, averaged over a ten year period. For the purpose of discussion, we expect the number of new homes added under this proposed bylaw change to be somewhere between half and double that amount, or 14–54 homes/year. Arlington has 7,998 single-family homes so this is a replacement rate well under 1%/year. It will be nothing like the 500 new homes/year that Arlington was building during the 1920s.
Assessing the impact on the school system amounts (in part) to estimating the number of new school students created by the addition of 14–54 homes/year. One can conceivably see this playing out according to three scenarios. Scenario 1 is simply “by the numbers”. The Housing section of Cambridge’s Alewife District Plan estimates one new student for every 17 new homes (see pg. 145), and the economic analysis of Arlington’s industrial districts gives a net increase of one new student for every 20 new condominiums (see slide 49). Both work out to an increase of 1–3 students per year for the addition of 14–54 homes. This is substantially smaller than past enrollment growth, and something the schools should easily be able to handle.
Second, one could imagine a scenario where elementary school enrollment is in modest decline, as students who entered Arlington public schools in the middle of the last decade move on to middle and high school. Here, new elementary students would utilize existing classroom space, which was created to accommodate students that came before them. It’s a scenario where enrollment stabilizes and doesn’t increase much.
Third, one could picture a scenario where any new home is immediately filled with children. Under this assumption it’s likely that any turnover of single-family homes or suitably-sized condominiums would attract families with children. With 7,998 single-family homes, there is little to prevent another demographic turnover from causing another increase in school enrollment, even if Arlington never adds a single additional home.
In summary, the effects on school enrollment are not easy to predict and several outcomes are possible. Ultimately, this will depend on Arlington’s attractiveness to young families, and our ability to retain these families once their students graduate from school.
Our Proposal to the Arlington Redevelopment Board
We propose that the Zoning Bylaw of the Town of Arlington be amended as
follows:
- By adding the letter “Y” to the “Use Regulations for Residential Districts” table in Section 5.4.3, in the row labeled “Two family dwelling, duplex”, and under the columns labeled “R0” and “R1”;
- By adding the letters “SP” to the “Use Regulations for Residential Districts” table in Section 5.4.3, in the row labeled “Six or more units in two-family dwellings or duplex dwelling on one or more contiguous lots”, and under the columns labeled “R0” and “R1”,
Class of Use | R0 | R1 | R2 |
Two-family dwelling | Y | Y | Y |
Six or more units in two-family dwellings or duplex dwelling on one or more contiguous lots | SP | SP | SP |
and, by making the following changes to the definitions of the R0 and R1 districts in Section 5.4.1(A):
R0: Large Lot Single-FamilyResidential District. The Large Lot Single-FamilyResidential District has the lowest residential density of all districts and is generally served by local streets only. The Town discourages intensive land uses, uses that would detract from the single-family residential character of these neighborhoods, and uses that would otherwise interfere with the intent of this Bylaw.
R1: Single-FamilyR1 Residential District. The predominant uses in R1 are single- and two-family dwellings and public land and buildings. The Town discourages intensive land uses, uses that would detract from the single-family residential character of these neighborhoods, and uses that would otherwise interfere with the intent of this Bylaw.
Related Materials
Our Redevelopment Board Hearing
We presented Article 18 to the redevelopment board on Oct 26th. You can watch the presentation below.
The Redevelopment Board did their deliberations and voting two days later, on October 28th. Their report is available from the Town website.
At least three members of the board were supportive of the effort, but they ultimately voted to recommend this action. I attribute the no action vote to two factors. First, in January 2020 the Redevelopment board agreed to perform a public engagement campaign, to educate residents on housing issues facing the town, and to gather input on how those issues could be addressed. The public engagement effort hasn’t started yet (mainly due to the pandemic), and the board was hesitant to recommend favorable action without doing an outreach campaign first.
Second, the board was interested in attaching standards to single- to two-family conversions, and didn’t feel there was enough time in this town meeting cycle to devise an appropriate set of standards. They were interested in design requirements and collecting payments to an affordable housing trust fund. Standards are interesting idea, and worthy of further consideration. For my own taste, I’d be more inclined to ask for performance standards that tied in to Arlington’s Net Zero Action plan.
So, we are going to take the ARB’s feedback, work on the idea some more, and resubmit during a future town meeting.
According to a Nov. 26, 2019 Boston GLOBE editorial, there are four tasks necessary to ease the housing crisis in the Greater Boston Region:
- Champion housing production and affordability at the state level.
- Urge private-sector investment in housing solutions.
- Drive inclusive growth.
- Get more involved locally.
This editorial by Paul S. Grogan, president and CEO of the Boston Foundation and Arlington resident, Karen E. Kelleher, executive director of LISC Boston, explain these four tasks. They also describe how much other, comparable urban areas around the US are doing to solve similar housing problems. We are not keeping up with solutions. It will take a collective effort. “Next Level Housing Solutions” is a collaboration of concerned organizations and community leaders intended to move the region toward housing solutions.
Join the Conversation. Click here to join the Next Level Housing Solutions conversation. This just means you will receive information and event updates.
This is the second in a series of “Arlington 2020” articles. The first article looked at the number of one-, two-, and three-family homes and condominiums in Arlington, and how that housing stock has changed over time. This article will examine changes in the value of those properties. We’re going to look at “value” through the lens of property assessments, so we should start with an explanation of what property assessments are and how they’re used.
A property assessment is simply the Town Assessor’s best estimate of what a property is worth, based on market values. The assessor’s office inspects properties every ten years; during intervening years, assessments are adjusted based on sale prices of similar homes in a given tax neighborhood. For all practical purposes, assessed values tend to trail market values by two years. In my neighborhood, property assessments are spot on — my house was assessed at $501,000 in 2020; during 2018, sales of similar homes in the neighborhood ranged from $495,000 to $520,000.
Condominiums have a single assessed value, which includes land and buildings. Otherwise, assessed values are broken down into land value, building value, and yard items (e.g., a garage or a shed).
Assessed values are used to determine the tax rate. The assessors page on the town website has calculations in worksheet form, but for all practical purposes, it’s just a division problem. One takes the total tax levy and divides by the sum of all property assessments (in thousands of dollars), and that’s the tax rate. An individual’s taxes are the assessed value of their property (in thousands of dollars) multiplied by the tax rate. If an individual owns (say) 1% of the assessed value in town, that individual will pay 1% of the property tax levy.
The main point is that assessed values are based on market values, but with a two-year lag. Consequently, we can use them as a way to see how home prices have changed over time.
With that background information out of the way, we can look at some numbers. Here’s a graph of the median assessed values for condominiums, one-family, two-family, and three-family homes from 2013 through 2020. (the “median” is a value such that half of the assessments are above, and half are below).
year | Condominium | Single Family | Two-family | Three-family |
2013 | $297,800 | $472,850 | $532,650 | $581,600 |
2014 | $300,150 | $484,400 | $530,000 | $574,800 |
2015 | $318,200 | $507,900 | $572,000 | $616,300 |
2016 | $351,050 | $546,300 | $623,150 | $673,550 |
2017 | $357,750 | $581,200 | $663,900 | $714,800 |
2018 | $395,400 | $618,800 | $732,100 | $787,600 |
2019 | $463,250 | $701,550 | $851,200 | $897,500 |
2020 | $473,100 | $771,900 | $944,000 | $1,010,850 |
%change | 58.87% | 63.24% | 77.23% | 73.81% |
As one would expect, two-family homes are worth more than single-family, and three-family are worth more than two. Condominiums have a lot of variety; they could be half of a duplex, or a single unit in an apartment building. But a general upward trend is clearly evident.
These values are straight out of the assessor’s database, and not adjusted for inflation. The Bureau of Labor Statistic’s inflation calculator shows 12% inflation between 2013 and 2020; the %change is pretty considerable, even if one deducts 12% for inflation.
Next, I’d like to dig further into the 1–3 family assessments, by breaking them down into the value of land vs the value of buildings, and showing how that’s changed over time.
Single-family homes:
year | Land value | Building value | Total assessed value |
2013 | $243,700 | $226,300 | $472,850 |
2014 | $253,750 | $227,050 | $484,450 |
2015 | $272,700 | $229,900 | $507,900 |
2016 | $296,400 | $243,950 | $546,400 |
2017 | $326,400 | $246,400 | $581,250 |
2018 | $360,900 | $248,100 | $618,800 |
2019 | $440,400 | $250,400 | $701,600 |
2020 | $448,600 | $316,300 | $771,900 |
%change | 84.08% | 39.77% | 63.24% |
Two-family homes:
year | Land value | Building value | Total assessed value |
2013 | $202,500 | $320,550 | $532,650 |
2014 | $212,250 | $307,800 | $530,000 |
2015 | $256,400 | $309,800 | $572,000 |
2016 | $262,500 | $349,400 | $623,150 |
2017 | $307,000 | $350,700 | $663,900 |
2018 | $352,500 | $373,900 | $732,100 |
2019 | $478,300 | $374,850 | $851,700 |
2020 | $454,500 | $486,100 | $944,000 |
%change | 124.44% | 51.65% | 77.23% |
Three-family homes:
year | Land value | Building value | Total assessed value |
2013 | $200,100 | $377,900 | $581,600 |
2014 | $209,100 | $364,100 | $574,800 |
2015 | $249,800 | $366,550 | $616,300 |
2016 | $259,950 | $412,350 | $673,550 |
2017 | $298,100 | $412,500 | $714,800 |
2018 | $343,050 | $438,800 | $787,600 |
2019 | $459,000 | $440,100 | $897,500 |
2020 | $440,100 | $578,450 | $1,010,850 |
%change | 119.94% | 53.07% | 73.81% |
There are several things worth pointing out in these breakdowns.
First, note that the land and building values “jump” a bit between 2019–2020. 2020 was one of our full reassessment years, so I’m willing to attribute this to a periodic course correction. The total increase is generally linear, but the land/building composition has changed.
Second, the median land value for single-family homes is higher than the median building value, for all years between 2013–2020.
Third, most of the increases come from changes in land value. I believe this comes down to location, location, and location. Arlington has a well-respected public school system, and it’s close to universities and tech centers is Cambridge and Boston, and office parks in Lexington, Waltham, and Burlington. City amenities are close at hand.
So what does one do about our rising home prices, and in particular, the rising value of land? The first (and perhaps default) answer is to do nothing. Rising property values are a boon to homeowners who purchased a capital asset (i.e., a house) in the past, and have seen its value appreciate over time. The downside of doing nothing is that each year, increasing housing prices create an ever-increasing income threshold for new residents.
An alternative approach would be to allow more (and smaller) units to be built on each lot. This requires reconstruction or redevelopment, but it allows the cost of land to be amortized among several households. More units/lot means more people and more density, but it reduces the income threshold for buying in to Arlington. (Note that the per-unit cost for three-family homes is lower than the per-unit cost for two-family homes. Similarly, the per-unit cost for two-family homes is lower than the cost of a single-family home).
A third article will look at the distribution of housing prices in Arlington, and how the distribution varies by housing type.
Here is a spreadsheet of data shown in this post.
(DRAFT – 7/11/2019)
Overview
Arlington Planning Department officials report on options for the Town to mitigate the effects of housing demolitions and housing replacements in neighborhoods.
Evidence suggests that lack of appropriate regulatory policies have led to incidences of “mcmansions” and other issues that concern neighborhood residents. This study looks at the data, the policy and regulatory options for Arlington. It also looks at how comparable nearby communities have managed similar circumstances.
This 42 page report covers a great deal of data and analysis of homes by zoning district, gaps in the effectiveness of the current regulatory structure, affects on affordability in Arlington by zoning district, information on housing prices and sales, etc.
“Best practices” include descriptions of demolition delay, expansion of local historic districts, neighborhood conservation districts, design review standards and guidelines and possible revisions to the regulatory framework in Arlington. The report also includes interesting case examples of how comparable communities near Arlington handle these issues.
This report was presented to the Arlington Select Board on July 22.
Read the complete report and see the available data and tables.
According to Richard Rothstein in his 2017 book, Color of Law: A Forgotten History of How Our Government Segregated America, “we have created a caste system in this country, with African-Americans kept exploited and geographically separate by racially explicit government policies,” he writes. “Although most of these policies are now off the books, they have never been remedied and their effects endure.” Zoning was one of the policies that contributed significantly to this outcome.
Here are some highlights, selected for Arlington readers, from this book:
P. VII
“… until the last quarter of the twentieth century, racially explicit policies of federal, state and local governments defined where white and African Americans should live. Today’s racial segregation in the North, South, Midwest, and West is not the the unintended consequence of individual choices and of otherwise well-meaning law and regulation but of unhidden public policy that explicitly segregated every metropolitan area in the United States. The policy was so systematic and forceful that is effects endure to the present time. Without our government’s purposeful imposition of racial segregation, the other causes – private prejudice, white flight, real estate starring, bank redlining, income differences, and self-segregation – still would have existed but with far less opportunity for expression. Segregation by intentional government action is not de facto. Rather, it is what courts call de jure: segregation by law and public policy. “
1917 – Buchanan v. Warley – Supreme Court case that overturned racial zoning ordinance in Louisville, Kentucky. Municipalities ignore and fought against this. Kansas City and Norfolk through 1987.
- Post WWII GI Bill – African Americans largely excluded from education and mortgage benefits
- Federal Housing Administration won’t insure mortgages to African Americans or mortgages in integrated neighborhoods. African Americans limited to non-amortizing loans, which means they build no equity in their homes while making payments
- Federal, stage and local governments are used to enforce race-restrictive covenants in deeds.
1948 – Shelley v. Kraemer – Although racially restrictive real estate covenants are not per se illegal, since they do not involve state action, a court cannot enforce them under the Fourteenth Amendment. FHA continues to not insure mortgages for African Americans.
1968 – Fair Housing Act endorsed the rights of African Americans to to reside wherever they chose and could afford. Finally ending the Federal Housing Administration’s’ role in mortgage insurance discrimination.
1969 – Mass 40B law passed
1972 – Head of Arlington ARB editorial talking about preserving the suburban way of life
1973 – Town Meeting passes moratorium on apartment construction
1975 – Arlington zoning re-do that all but stops development
1977 – Supreme Court upholds Arlington Heights, IL zoning that prohibited multi-unit development anywhere by adjacent to an outlying commercial area. In meetings leading to the adoption of these rules, the public urged support for racially discriminatory reasons.
p. 179″Residential segregation is hard to undo for several reasons:
- Parents’ economic status is commonly replicated in the net generation, so once government prevented African Americans from fully participating in the mid-twentieth-century free labor market, depressed incomes became, for many, a multi-generational trait
- The value of white working and middle-class families’ suburban housing appreciated substantially over the years, resulting in a vast wealth difference between whites and blacks that helped to define permanently our racial living arrangements. Because parents can bequeath assets to their children, the racial wealth gap is even more persistent down through the generations than income differences.
- Once segregation was established, seemingly race-neutral policies reinforced it to make remedies even more difficult. Perhaps most pernicious has been the federal tax code’s mortgage interest rate deduction, which increased the subsidies to higher-income suburban homeowners while providing no corresponding tax benefit for renters. Because de jure policies of segregation ensured that whites would be more likely to be owners and African Americans would more likely be renters, the tax code contributes to making African Americans and whites less equal, despite the code’s purportedly nonracial provisions.
Equitable Arlington, along with City Life/Vida Urbana and the Harvard Legal Aid Bureau, supports the legacy tenants of 840/846 Massachusetts Avenue in their resistance to rent increases of up to 50%. We urge the buildings’ owner, Torrington Properties, to continue negotiating an agreement with the tenants rather than pursue legal action likely to end in housing court. If more gradual increases are incompatible with Torrington’s business plan, we hope to see the sale of the property to the Housing Corporation of Arlington or another buyer who is committed to keeping the existing tenants in their homes.
The property, whose two larger buildings date to 1940 and 1963, faces Arlington High School, within easy reach of shopping and transit. It occupies one of relatively few spots in Arlington where people can live without a car. (Equitable Arlington and the MBTA Communities plan seek to encourage exactly this kind of housing.) Many of the middle- and lower-income tenants have been there for decades, including teachers, musicians, and some Section 8 voucher recipients. Some are immigrants with limited English. Laura Frost, who has lived there for 20 years, describes the apartments as “unofficial,” and therefore legally unprotected, affordable housing. Erica Schwarz, executive director of the Housing Corporation of Arlington, concurs: “There are so few places where low-income tenants are in units that aren’t restricted.”
When Torrington Properties bought the buildings in 2019, it did not raise rents right away. Instead, the company pursued a familiar strategy of remodeling apartments when tenants moved out and then marketing them as “luxury” units. More recent arrivals are paying typical market rents. Of the longtime residents, several have left because they were worried about being pushed out to make way for more remodeling and steep rent increases, says Frost, who leads the tenants’ association. All have been tenants at will since Torrington bought the property, with their rents not rising but also not guaranteed by 12-month leases. In November 2022, she says, Torrington distributed a list of target rents for all of the units. A few months later, it informed legacy tenants, then about 20 in number, that they needed to either sign leases at the new rates or move out.
“Our position was never ‘You can’t raise rents ever,’” says Frost, who recognizes that Torrington can legally set rents at any level. Working with City Life/Vida Urbana, she hoped for an agreement for more gradual rent increases, like the one Torrington had just reached with tenants near Forest Hills in Boston. By last spring, however, negotiations had broken down. A rally she organized in September drew Reps. Garballey and Rogers. In February, Torrington sent the legacy tenants notices to quit. We are encouraged that negotiations have since resumed. At the same time, we support a more sustainable option for these tenants and anyone who lives there in the future, as well as Arlington as a whole: a commitment, perhaps by a new owner, to keeping some units affordable in the long term.
Schwarz, of the Housing Corporation of Arlington, has discussed purchasing the property from Torrington, which named a price she describes as “a few million dollars more” than HCA can offer. She has been exploring alternative ways to structure a purchase. This would include drawing on the Town of Arlington’s ARPA funds, as well as seeking mission-aligned equity partners for the project under a “mixed income” model. This would not displace any current tenants, but would, over time, provide a very high percentage of affordable units at a range of income levels, while also providing middle-income and market rate units.
Equitable Arlington supports common-sense reforms that allow for more housing options and tenant protections for current and future Arlington residents. We support increased funding for affordable housing, both through the Affordable Housing Trust Fund and state and federal subsidies, and a wider range of housing choice for every income level and every life stage. We also champion housing that is sustainable, equitable, and accessible, including locating additional housing near public transportation, all of which we believe will make Arlington an even more welcoming community.
The City of Somerville estimates that a 2% real estate transfer fee — with 1% paid by sellers and 1% paid by buyers, and that exempts owner-occupants (defined as persons residing in the property for at least two years) — could generate up to $6 million per year for affordable housing. The hotter the market, and the greater the number of property transactions, the more such a fee would generate.
Other municipalities are also looking at this legislation but need “home rule” permission, one municipality at a time, from the state to enact it locally. Or, alternatively, legislation could be passed at the state level to allow all municipalities to opt into such a program and design their own terms. This would be much like the well regarded Community Preservation Act (CPA) program that provides funds for local governments to do historic preservation, conservation, etc.
This memorandum from the City of Somerville to the legislature provides a great deal of information on the history, background and justification for such legislation.
House bill 1769, filed January, 2019, is an “Act supporting affordable housing with a local option for a fee to be applied to certain real estate transactions“.
COMMENT:
KK: This article suggests Arlington may be likely to pass a real estate transfer tax: https://www.counterpunch.org/2019/12/19/boston-one-step-closer-to-a-luxury-real-estate-transfer-tax/
A report by Mass Housing Partnership’s Shelly Goehring looks at Arlington’s housing development history and policies to understand how municipal action and inaction can contribute to housing inaffordability and can limit the population diversity within a community. The report implies that it has been difficult historically for reputable housing developers to work with the regulatory structure within Arlington to get housing built.
Massachusetts has the nation’s 2nd largest gap in homeownership between households of color (31% own homes) and white households (69% own homes).
See the complete report for more information.