A few days ago, the Boston Globe ran an article titled “2021 set records in Boston Housing Market. What now?“. It’s not unusual to see stories about housing in the news — the market is highly competitive and the sale prices can be jaw dropping. Jaw dropping can take several forms: from the new (and used) homes that sell for over two million dollars, to the amount of money that someone will pay to purchase a small post-war cape (around $900,000, give or take).
According to the globe article, the Greater Boston Association of Realtors estimates that the median price of a single family homes in the Boston area rose 10.5% in 2021, to $750,000. Arlington is comfortably in the upper half of this median: according to our draft housing production plan the median sale price of our single family homes was $862,500 in 2020, and rose to $960,000 in the first half of 2021 (see page 39).
In June 2021, I got myself into a habit of sampling real estate sales listed in the Arlington Advocate, and compiling them into a spreadsheet. My observations are generally consistent with the sources cited above; Arlington’s housing is expensive and it’s appreciated rapidly, particularly in the last 6–10 years. It’s a great time for existing owners, but less so if you’re in the market for your first home.
We’re actually facing two problems, which are related but not identical. The first is high cost, which creates financial stress and a barrier to entry (though it is a boon for those who sell). The second problem is quantity; there are regional and national housing shortages, and that contributes to high prices and bidding wars.
Addressing these challenges will require collective effort on behalf of all communities in the metro area; this is a regional problem and we’ll all have to pitch in. There isn’t a single recipe for what “pitching in” means, but here are some for what communities can do.
First, produce more affordable housing. Affordable housing is a complex regulatory subject, but it basically boils down to two things: (1) the housing is reserved for households with lower incomes than the area as a whole, and (2) there’s a deed restriction (or similar) that prevents it from being sold or rented at market rates. Affordable housing usually costs more to produce than it generates in income, and the difference has to be made up with subsidies. It takes money.
Second, simply produce more housing. This is the obvious way to address an absolute shortage in the number of dwellings available. Some communities have set goals for housing production. Under the Walsh administration, Boston set a goal of producing 69,000 new housing units by 2030. Somerville’s goal is 6000 new housing units, and Cambridge’s is 12,500 (page 152 of pdf). To the best of my knowledge, Arlington has not set a numeric housing production goal, but it’s something I’d like to see us do.
Finally, communities could be more flexible with the types of housing they allow. Arlington is predominantly zoned for single- and two-family homes. The median sale price of our single family homes was $960,000 during the first half of 2021, and a large portion of that comes from the cost of land. That’s the reality we have, and the existing housing costs what it costs. So, we might consider allowing more types of “missing middle” housing, where the per dwelling costs tend to be lower: apartments, town houses, triple-deckers, and the like.
Of course, this assumes that our high cost of housing is a problem that needs to be solved; we could always decide that it isn’t. In the United States, home ownership is seen as a way to build equity and wealth. It’s certainly been fulfilling that objective, especially in recent years.
It’s January 2023, and as we do every year, folks in Arlington are taking out nomination papers, gathering signatures, and strategizing on how to campaign for the town election on Saturday April 1st. The town election is where we choose members of Arlington’s governing institutions, including the Select Board (Arlington’s executive branch), the School Committee, and — most relevantly for this post — Town Meeting.
If you’re new to New England, Town Meeting is an institution you may not have heard of, but it’s basically the town’s Legislative Branch. Town Meeting consists of 12 members from each of 21 Precincts, for 252 members total. Members serve three-year terms, with one-third of the seats up for election in any year, so that each precinct elects four representatives per year (perhaps with an extra seat or two, as needed to fill vacancies). For a deeper dive, Envision Arlington’s ABC’s of Arlington Government gives a great overview of Arlington’s government structure.
As our legislative branch, town meeting’s powers and responsibilities include:
Town Meeting is an excellent opportunity to serve your community, and to learn about how Arlington and its municipal government works. Any registered voter is eligible to run. If this sounds like an interesting prospect, I’d encourage you to run as a candidate. Here’s what you’ll need to do:
Town Meeting traditionally meets every Monday and Wednesday, from 8:00 — 11:00 pm, starting on the 4th Monday in April (which is April 24th this year), and lasting until the year’s business is concluded (typically a few weeks).
If you’d like to connect with an experienced Town Meeting Member about the logistics of campaigning, or the reality of serving at Town Meeting, please email info(AT)equitable-arlington.org and I’d be happy to make an introduction.
During the past few years, Town Meeting was our pathway to legalizing accessory dwelling units, reducing minimum parking requirements, and loosening restrictions on mixed-use development in Arlington’s business districts. Aside from being a rewarding experience, it’s a way to make a difference!


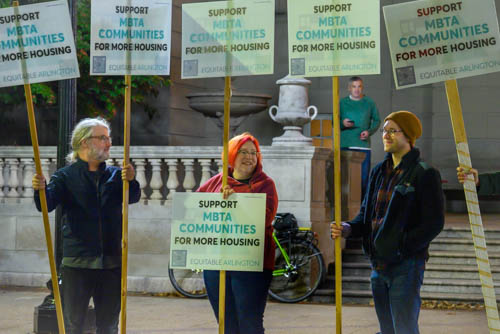
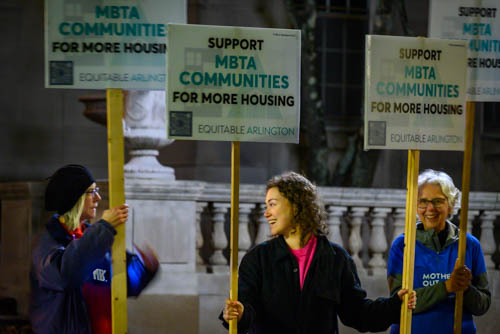
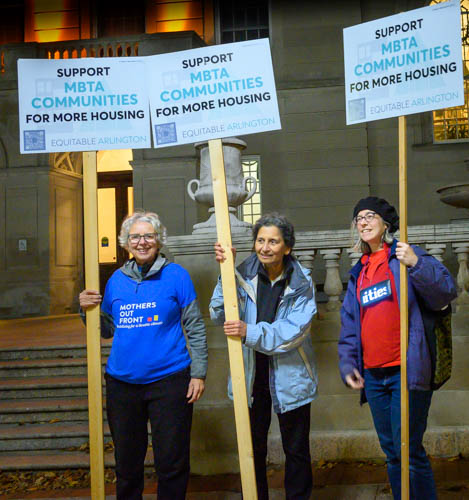
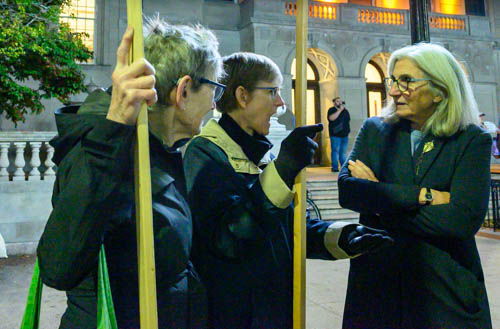
What a turnout! Equitable Arlington, joined by Mothers Out Front and other Arlington organizations, showed up strong in support of the MBTA Communities plan. Sign-holders stretched along the street for the full length of Town Hall on Monday, October 23, for an hour before Town Meeting. In some cases people were stacked two deep!
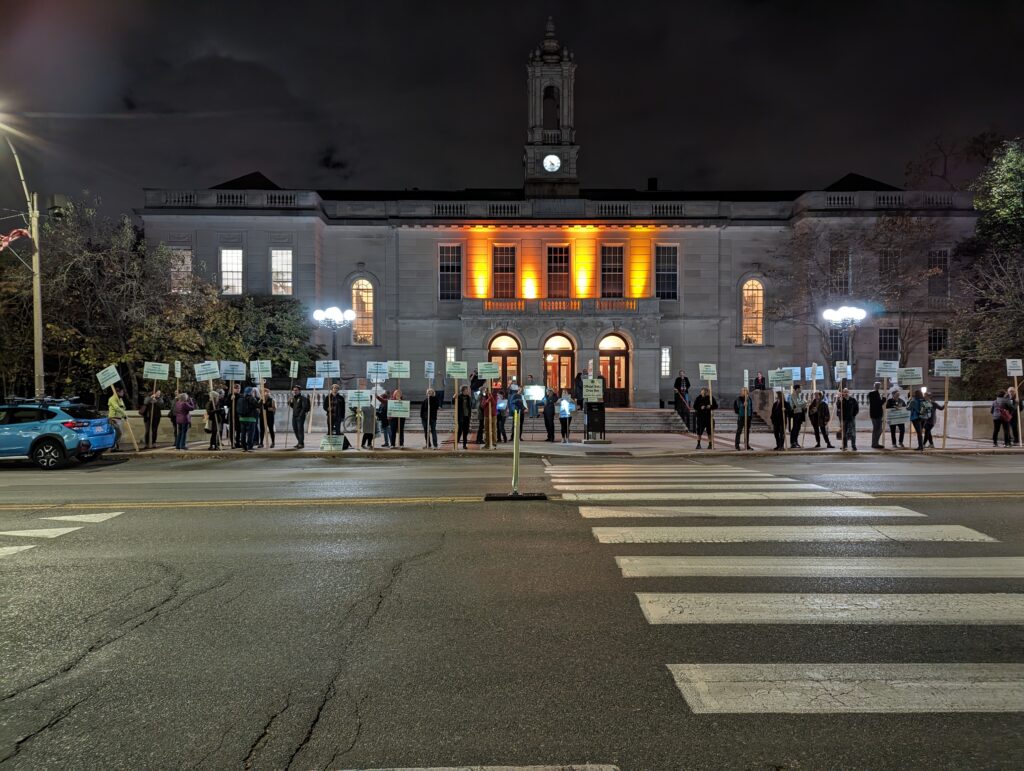
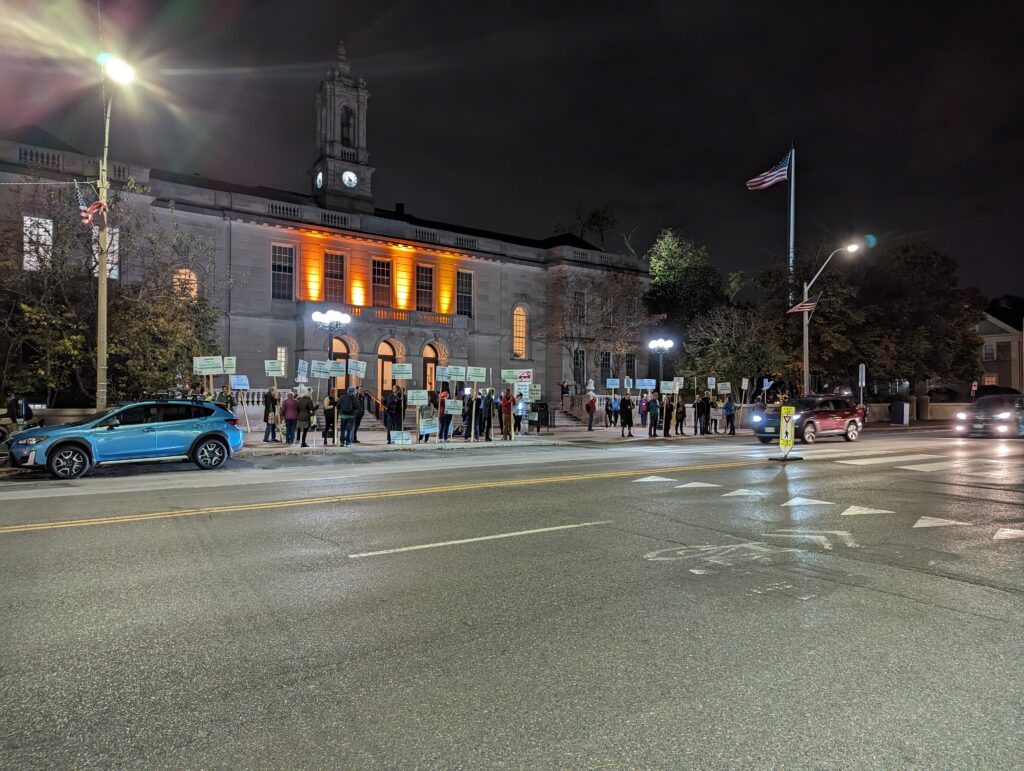
Everyone’s spirits were high throughout the rally. Passers by honked their horns in support.

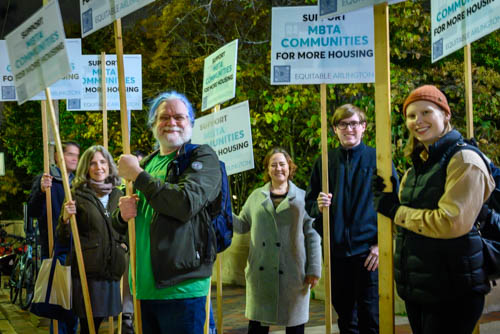

And State Senator Cindy Friedman even came by to reinforce her support for the measure!
Huge thanks to everyone who showed up for Arlington on Monday night!
By Luc Schuster, CommonWealth Magazine, 11/16/19
There are actually two parts to the housing crisis now facing the region.
First, our society acknowledges the need to respect human rights and to provide a safety net for many for health care, food, etc. But there are no safety nets for housing. What Massachusetts has is a cobbled together patchwork of low-income housing programs and subsidies. But it leaves far too many behind.
Second, middle income families headed by school teachers, salespeople, nurses, non-profit workers, and retirees living on fixed incomes can not afford the average price of housing in the Greater Boston region. There are solutions, like allowing more density around public transit corridors and like permitting zoning changes to pass with a simple majority. Zoning changes are also necessary to move us toward a more sustainable environment.
by Steve Revilak
On Tuesday August 6, 2024, Governor Healey signed the Affordable Homes Act (H.4977) into law. It’s a significant piece of legislation that will take positive strides toward addressing our state’s housing crisis. At 181 pages, the Affordable Homes Act is a lengthy bill, but the things it does generally fall into three categories: funding, changes to state law, and changes to state agencies.
The act authorizes more than five billion dollars to fund the creation, maintenance, and preservation of housing. This includes $425M to housing authorities and local housing initiatives (including $2.5M for the Arlington Housing Authority), $60M to assist homeowners or tenants with a household member with blindness or severe disabilities, $70M for community-based efforts to develop supportive housing for persons with disabilities, and $100M to expand opportunities for first-time homebuyers.
The Affordable Homes Act makes several changes to Massachusetts zoning laws, including the legalization of accessory dwelling units (ADUs) statewide. ADUs, also known as “granny flats” or “in-law apartments,” are a cost-effective way to add new housing, and they’re typically used to provide living quarters for relatives or caretakers, or to generate rental income for homeowners. ADUs are now allowed in all single-family zones in Massachusetts, by right, without the need for a discretionary permit. Arlington has been a leader in this area, having passed an ADU bylaw in 2021, and it’s great to see this option extended throughout the Commonwealth.
Finally, the Affordable Homes Act makes a number of changes to state agencies, especially the Executive Office of Housing and Livable Communities (EOHLC). The Act establishes a new Office of Fair Housing within the EOHLC, to “advance the elimination of housing discrimination.” The Fair Housing office will provide periodic reports on progress towards achieving this goal. EOHLC is also charged with creating and implementing a state-wide housing plan that will consider supply and demand, affordability, challenges unique to different regions of the state, and an analysis of local zoning laws.
While our legislators deserve kudos for putting this package together, they also deserve kudos for what they left out. More than three hundred amendments were filed during House deliberations, and a number of them were intended to weaken the multi-family housing requirements of the MBTA Communities Act. For example, one amendment, simply titled “Technical Correction” would have rewritten the transit community definitions, in order to reduce the housing requirements for Milton. We are heartened that our legislators did not go along with such shenanigans.
This letter appeared in the Boston Globe on Dec. 19th. It’s reprinted
here with permission from the author, Eugene Benson.
The Dec. 12 letter from Jo Anne Preston unfortunately repeats misinformation making the rounds in Arlington (“Arlington is a case study in grappling with rezoning“).
At April Town Meeting, the Arlington Redevelopment Board recommended a vote of no action on its warrant article that would have allowed increased density along the town’s commercial corridors in exchange for building more affordable housing (known as “incentive zoning”), when it became obvious that the article would be unlikely to gain a two-thirds vote for passage, in part because of the complexity of what was proposed.
A warrant article to allow accessory dwelling units in existing housing (“in-law apartments”) gained more than 60 percent of the vote at Town Meeting but not the two-thirds vote necessary to change zoning.
The letter writer mentioned “naturally occurring affordable apartment buildings.” The typical monthly rent for an apartment in those older buildings ranges from about $1,700 for a one-bedroom to about $2,300 for a two-bedroom, according to real estate data from CoStar. Those are not affordable rents for lower-income people. For example, a senior couple with the national average Social Security income of about $2,500 per month would spend most of their income just to pay the rent.
We need to protect the ability of people with lower incomes to withstand rent increases and gentrification. That, however, requires a different approach than hoping for naturally occurring affordable housing to be there even five years from now.
Eugene B. Benson
Arlington
The writer’s views expressed here are his own, and are not offered on behalf of the Arlington Redevelopment Board, of which he is a member.
Last Spring, as Town Meeting considered zoning options for increasing the amount of housing, including affordable housing in Arlington, some citizens rallied against this effort. The reason: Housing is built by developers. Developers are greedy and can not be trusted. Ergo the community must prohibit developers. But much of the Arlington now cherished was planned and built by developers.
This article from the New York Times helps shed a perspective on the role of developers and suggests ways they are critically important to improving and revitalizing communities over time. Yes some developers’ interests may diverge from the community’s interests. Clear land use planning and regulations make it a better opportunity for both sides. Good developers bring skills in planning, finance, architecture and community engagement. They work with the risk that if they do the job well, they make some money. They could lose money. They don’t get paid by the hour. Both sides, community and developer, take risks. But there are rewards for each side too when the sides work together.
A study by Elise Rapoza and Michael Goodman shows that new housing construction in MA does not have an adverse affect on municipal or school budgets. And when it might, state funding covers the difference. This study contradicts the often heard argument against new housing development, especially multi-family housing, because it, the argument claims, it will have a negative fiscal impact on communities.
In the aggregate, development of new housing offers net fiscal benefit to both municipalities and the state. Additional analysis validates a second study which found that increased housing production does not predict enrollment changes in Massachusetts school districts. In the new study, a distinct minority of municipalities did incur net fiscal burdens—burdens that the net new state tax proceeds associated with the development of new housing are more than sufficient to offset.