Many issues are under discussion as a result of these proposed zoning Articles. Issues include: housing affordability, the diversity of housing and incomes in Arlington, environmental concerns and sustainability, tax burdens or tax savings potentially resulting from growth, the risk of postponing the decisions, and the image of Arlington as a community that values diversity and equitability. This one page “fact sheet” attempts to address many of these issues and concerns.
Related articles
The kick-off event for updating Arlington’s Comprehensive Plan (formerly called the Master Plan) is just around the corner on April 3rd from 7-8:30 PM in the Arlington High School Cafeteria!
A Comprehensive Plan is a long-range plan for the Town, and an opportunity for the community to come together and imagine what Arlington could look like in ten or fifteen years. It covers things like housing, business development, parks and open spaces, town services and facilities, and transportation. The kickoff meeting is the first step in building that vision.
Arlington residents of all ages are invited to attend this event, where you can expect a presentation followed by small group discussions. The effort will continue throughout the year, and it’s important to hear from as many residents as possible. Please join if you can!
For more information and to add the meeting to your calendar, see ArlingtonMA.gov/CompPlan.
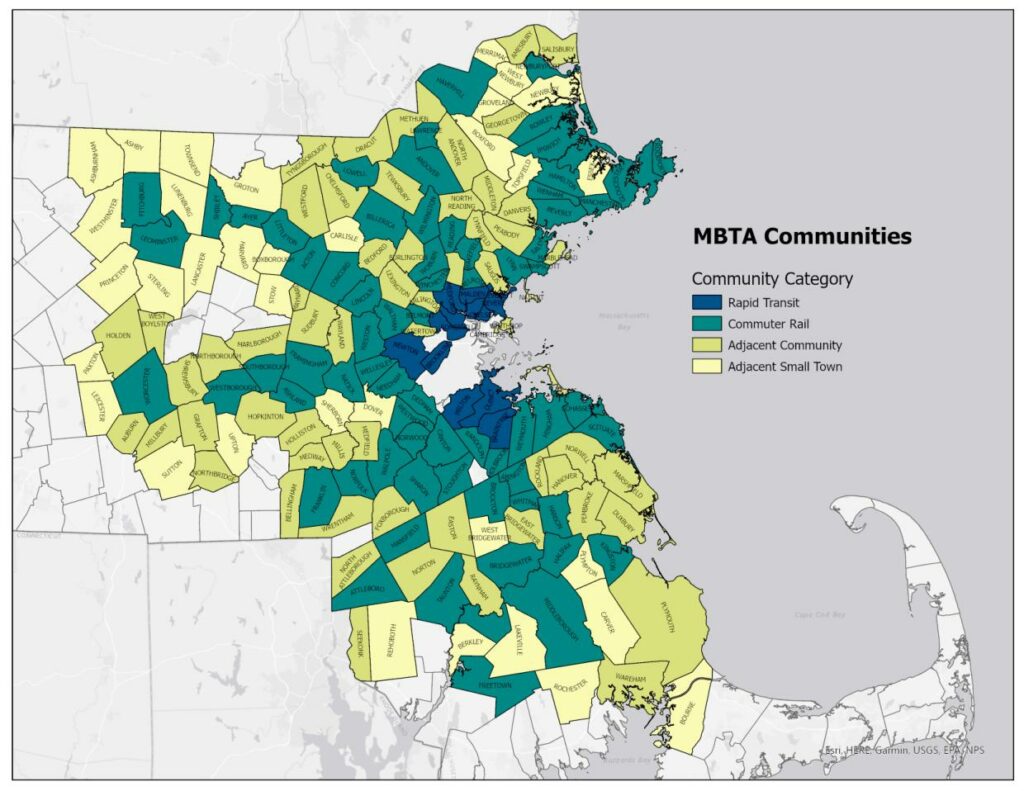
Massachusetts’ 2020 Economic Development Bill included a set of housing choice provisions: these require communities served by the MBTA to provide a district of reasonable size where multi-family housing is allowed by right. The law gives us significant flexibility to design a district that best suits our needs, but the district must allow housing suitable for families with children, without age restrictions, and at a rate of at least 15 dwelling units per acre. Arlington is one of 175 MBTA communities in Massachusetts that share in the responsibility for meeting these requirements.
The law requires a “district of reasonable size”, but what does that mean? Throughout much of 2021 the Massachusetts Department of Housing and Community Development (DHCD) worked on a set of supporting regulations that set the district requirements according to the type of transit service a community has, the number of existing homes in the community (as of the 2020 Census), and the amount of developable land near transit stations. The specifics vary by community, but here is what the requirements mean for Arlington:
- Our district needs a capacity of (at least) 2,046 homes. This isn’t a requirement to build 2,046 additional homes; instead, it reflects the total number of homes that district might contain in the future. For example, if a parcel with a two-family home were rezoned to allow a three-family home, that single parcel would have a capacity of three.
- Our district needs to allow multi-family housing by right. “By right” means that the development only requires a building permit, where the Building Inspector determines whether the project complies with zoning and building codes. While Arlington allows multi-family housing (three or more dwellings on a single parcel) in some areas, such projects are not allowed by right.
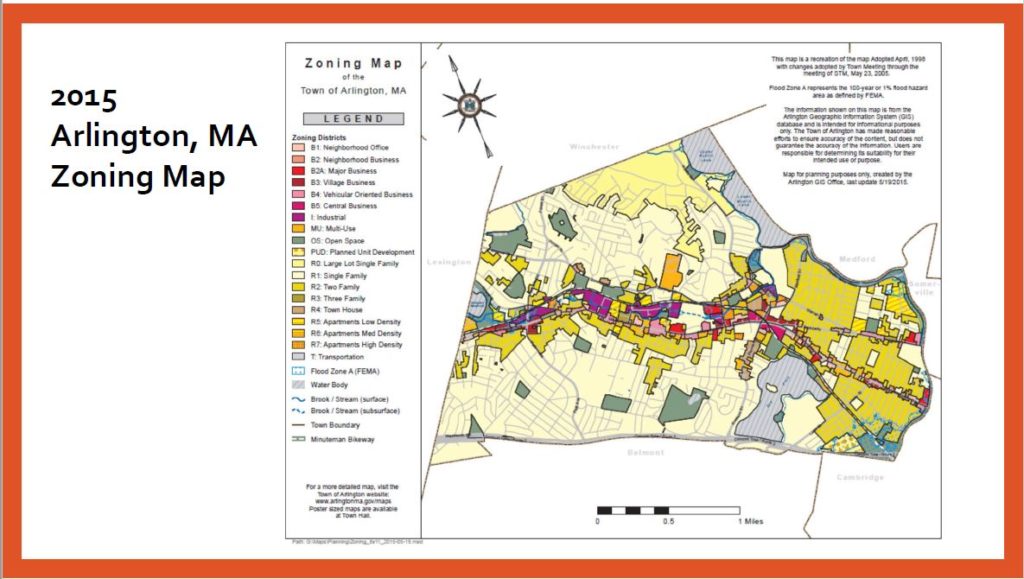
- Our district needs to allow (at least) 15 dwellings/acre. This is more or less in line with the density of the streetcar suburbs that were built in East Arlington during the 1920s. Although portions of Arlington likely meet the density requirement, none of these areas currently comply, as they don’t allow multi-family housing to be built by right.
- Our district needs to be at least 32 acres, but it could be larger. We have flexibility here, as we’ll discuss in a moment.
- Finally, due to the lack of developable land around the Alewife T station, Arlington is free to locate its multi-family district (or districts) anywhere in town. We’re not tied to any particular geographic location.
The new law’s requirements provide Arlington with a great deal of flexibility. We’re free to place our district (or districts) anywhere in town, and we’ll be able to choose from a variety of options as long as they meet the requirements set forth above. For example, providing the capacity of 2,046 homes in the minimum district size of 32 acres would give us a density of 64 dwellings/acre; roughly the scale of mid-rise apartment buildings. On the other hand, if we went with the minimum density of 15 dwellings/acre, we’d have a 135 acre district that allowed smaller multi-family homes. Our district can be anywhere within this range; we also have the option of having multiple districts, with smaller multi-family buildings in some areas of town and larger multi-family buildings in others.
Arlington has a track record of producing thorough and comprehensive planning documents, such as our Master Plan, Net Zero Action Plan, Sustainable Transportation Plan, and Housing Production Plan. These plans contain plenty of building blocks that could be used to formulate a compliant multi-family district. Viewed in that light, the MBTA community requirements are an opportunity to meet some of the goals we’ve already set for ourselves; we just have to go about it in a way that satisfies the law’s new requirements.
Arlington has one unique consideration, which doesn’t apply to most MBTA communities. In 2020, Arlington’s Town Meeting sent a home rule petition to the state legislature, asking for permission to regulate the use of fossil fuels in new building construction; it’s an important component of our plan to become carbon-neutral by 2050. A number of other communities in the Commonwealth filed similar petitions, and the legislature responded by establishing a pilot program: ten cities and towns will be allowed to enact “fossil fuel bans”, but only if they (a) have 10% subsidized housing, (b) achieve safe harbor via compliances with an approved housing production plan, or (c) establish a multi-family district of reasonable size by February 2024. Arlington doesn’t meet the subsidized housing requirement (only 6.54% of our homes are on the subsidized housing inventory), and we’re unlikely to gain safe harbor status during the next year; our most viable path to participation hinges on meeting the multi-family requirements.
In summary, the multi-family requirement for MBTA communities creates new requirements for Arlington, while also presenting us with new opportunities: the opportunity to meet planning goals, the opportunity to meet sustainability goals (e.g., by regulating fossil fuel use in new construction), and the opportunity to reimagine how we do multi-family housing in Arlington as our town moves forward into the twenty-first century.
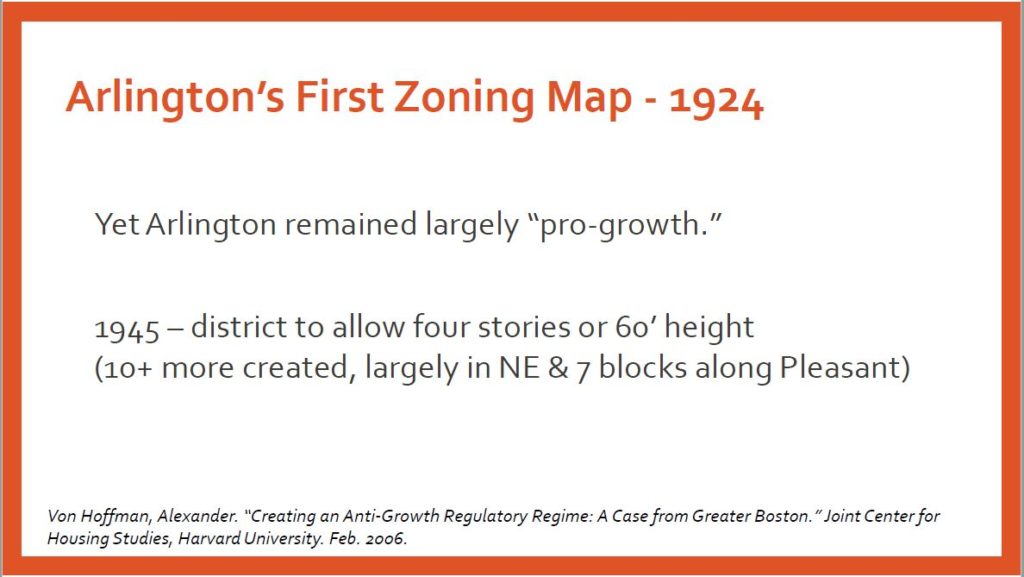
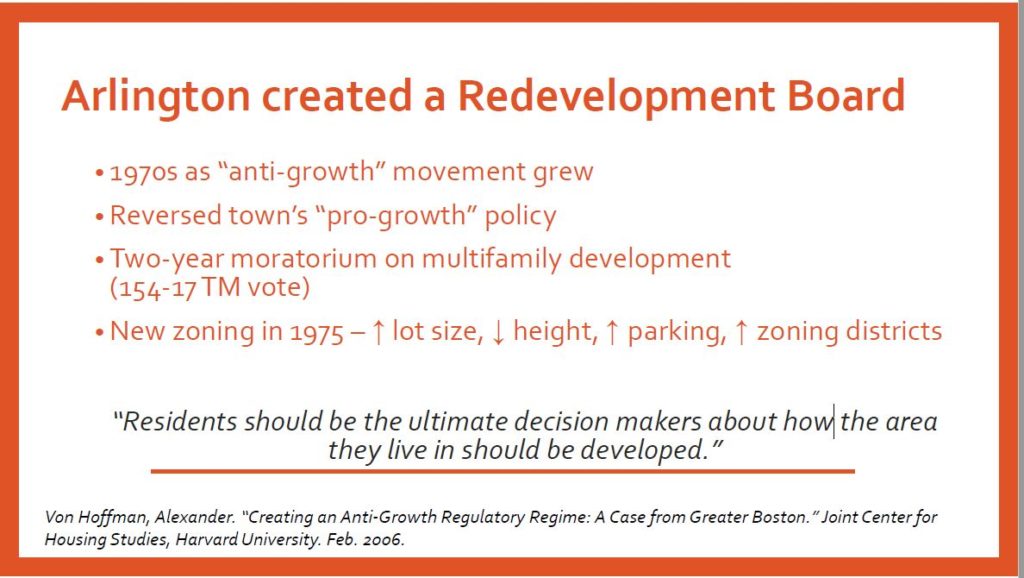
A report by Mass Housing Partnership’s Shelly Goehring looks at Arlington’s housing development history and policies to understand how municipal action and inaction can contribute to housing inaffordability and can limit the population diversity within a community. The report implies that it has been difficult historically for reputable housing developers to work with the regulatory structure within Arlington to get housing built.
Massachusetts has the nation’s 2nd largest gap in homeownership between households of color (31% own homes) and white households (69% own homes).
See the complete report for more information.
Dave Weinstock, an Arlington resident interested in affordable housing wondered about the concept of “developer math”. The math involved in planning an affordable housing projects is a problem that needs to get solved in order to have anything built here in Arlington, or anywhere. This topic comes up frequently in community discussions about the need for more housing.
Questions are raised around:
- 1- Why build so many units vs. smaller buildings
- 2- Why parking is costly and inefficient use of land
- 3- Why can’t more affordable or all affordable units be built?
- 4- The cost of subsidizing affordable units and how that may translate to higher rental rates/costs, etc.
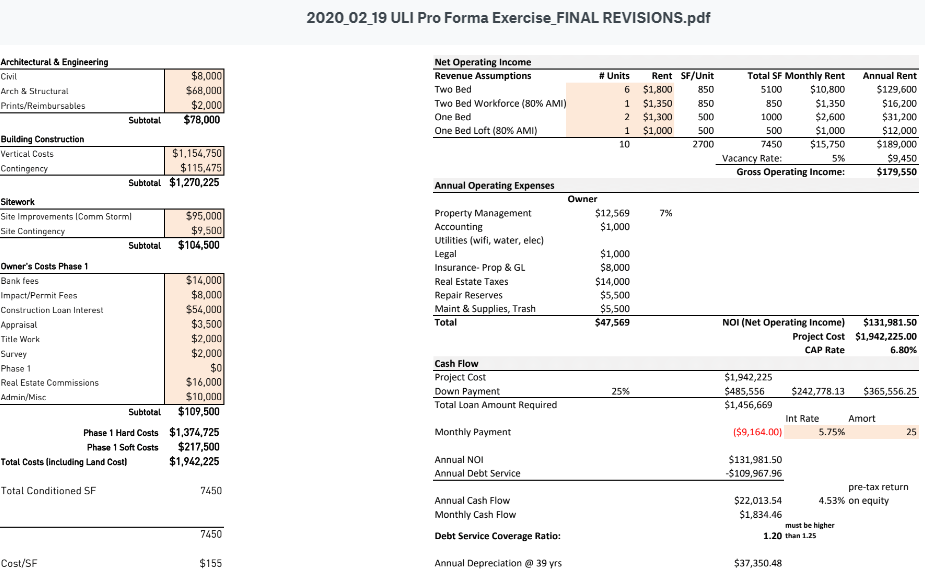
Dave found a great Architecture and Development firm in Atlanta (Kronberg Urbanists + Architects, based in Atlanta GA) that lays out a nice presentation, includes sample proformas, and real life scenarios that may help us understand this piece of the puzzle better when evaluating any project and how developers may be incented to build certain types of projects or do certain types of work.
Here is a link, reformatted to be within this website, to the presentation, showing the varieties of choices, costs, formulas and outcomes developers consider before deciding if the project can be built: https://equitable-arlington.org/developer-math_kua_071420/
Much of our hope for more affordable housing depends on the market forces of capitalism and the willingness of developers to build for good, not just for profit. But the developers must be able to cover their costs. Many communities are highly skeptical of developers, assuming the community will get tricked, the developer will get greedy and the promised housing will be a disappointment. Trust is needed. But so is verification. We all need to learn the developer math.
What are the math factors that a developer considers before deciding to build affordable housing?
Here is a link to the original presentation. https://www.kronbergua.com/post/mr-mu-let-s-talk-about-math
This timely report on the question of affordable housing vs. density comes from the California Dept. of Housing & Community Development and mirrors the situation in the region surrounding Arlington MA.
Housing production has not kept up with job and household growth. The location and type of new housing does not meet the needs of many new house- holds. As a result, only one in five households can afford a typical home, overcrowding doubled in the 1990’s, and too many households pay more than they can afford for their housing.
Myth #1
High-density housing is affordable housing; affordable
housing is high-density housing.
Fact #1
Not all high density housing is affordable to low-income families.
Myth #2
High-density and affordable housing will cause too much traffic.
Fact #2
People who live in affordable housing own fewer cars and
drive less.
Myth #3
High-density development strains public services and
infrastructure.
Fact #3
Compact development offers greater efficiency in use of
public services and infrastructure.
Myth #4
People who live in high-density and affordable housing
won’t fit into my neighborhood.
Fact #4
People who need affordable housing already live and work
in your community.
Myth #5
Affordable housing reduces property values.
Fact #5
No study in California has ever shown that affordable
housing developments reduce property values.
Myth #6
Residents of affordable housing move too often to be stable
community members.
Fact #6
When rents are guaranteed to remain stable, tenants
move less often.
Myth #7
High-density and affordable housing undermine community
character.
Fact #7
New affordable and high-density housing can always be
designed to fit into existing communities.
Myth #8
High-density and affordable housing increase crime.
Fact #8
The design and use of public spaces has a far more
significant affect on crime than density or income levels.
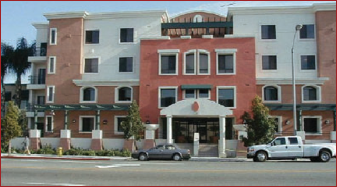
See an example of a “case study” of two affordable housing developments in Irvine CA, San Marcos at 64 units per acre.
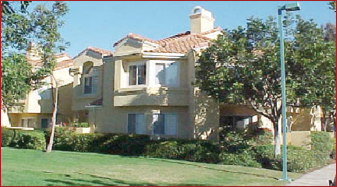
San Paulo at 25 units per acre.
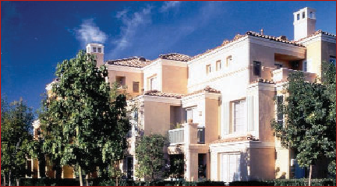
Both are designed to blend with nearby homes.