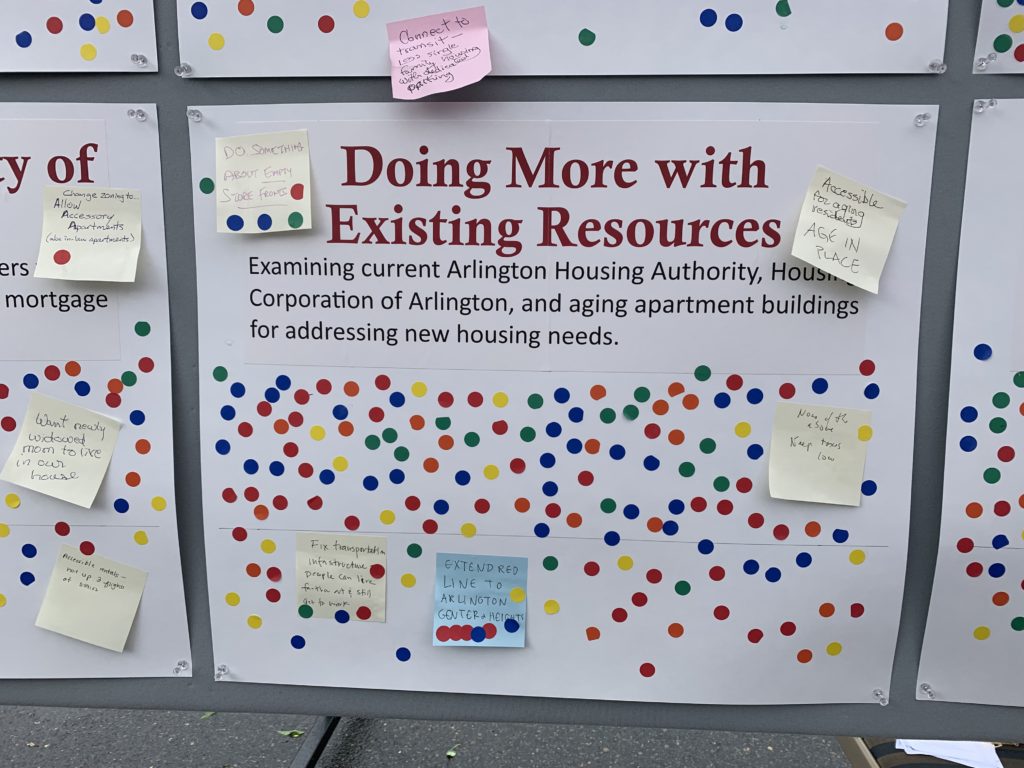
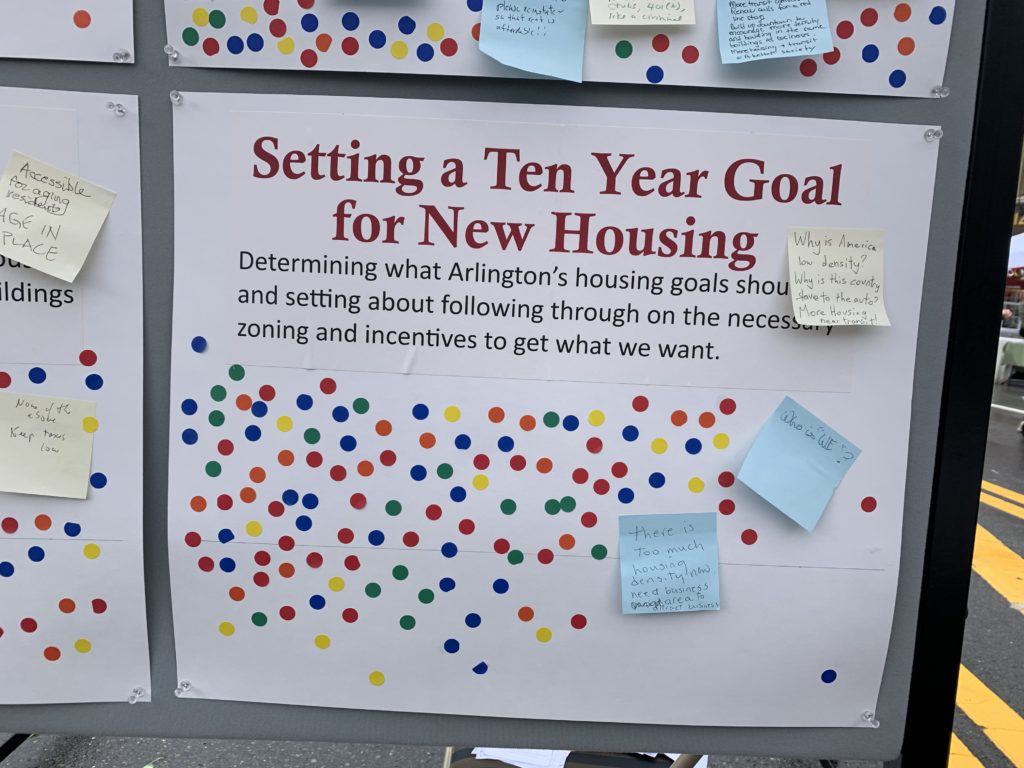
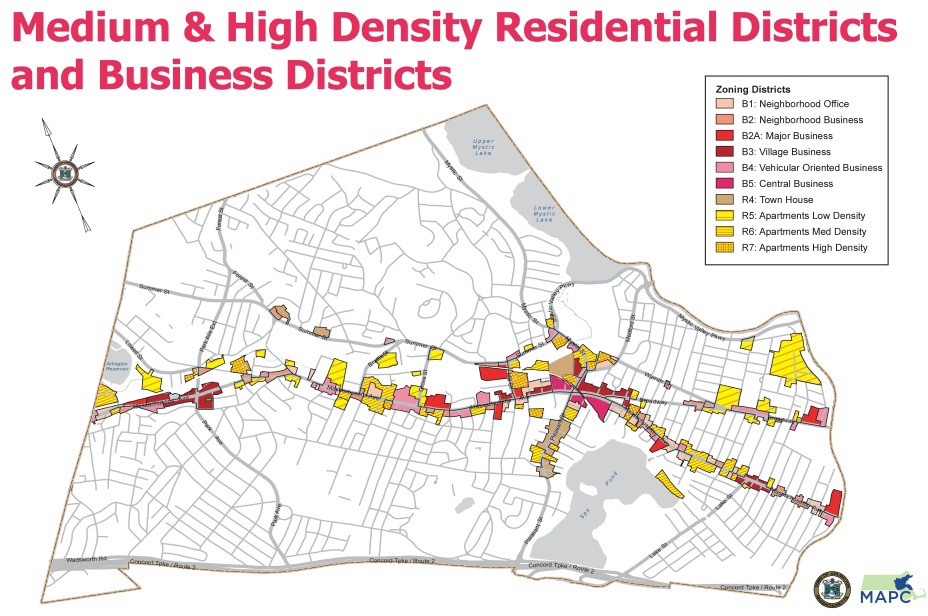
The discussions on zoning have been confusing because while zoning covers ALL of Arlington’s land and the zoning bylaws for all Arlington’s zones are referenced, the key issues of greatest interest to Town Meeting are the discussions about increasing density. These discussions pertain ONLY to those properties currently zoned as R4-R7 and the B (Business) districts. These density related changes would affect only about 7% of Arlington’s land area. The map shows the specific zones that would potentially be affected. They lay along major transportation corridors.
Related articles
This 102 page document is the most recently revised set of recommendations by the Town of Arlington’s Redevelopment Board. The report takes into consideration the comments and information provided over the last few months’ public hearing process. It also incorporates a citizen petition which strengthens the case for increasing permanent affordable housing with the passage of these zoning related Articles. Town Meeting convenes on April 22, 2019.
Minneapolis is the most recent governmental entity to disrupt the almost 110 year old idea of local zoning in America by overriding single family zoning. Zoning was developed in the the early 1900’s to control property rights and, in part, to limit access to housing by race. These early laws were upheld by the courts in the 1930’s and the use of zoning to control private property for the interests of the majority became common. Houston Texas did not adopt zoning, an outlier in the nation.
But recently governments are rethinking zoning in light of evidence of exclusionary practices including racism and inadequate supplies of affordable housing. In July Oregon’s legislature voted to essentially ban single family zoning in the state.
Most recently, in the end of July, Minneapolis became the first city this century to remove single family zoning, allowing two family housing units to enter any single family zone as of right. According to the Bloomberg News article, the city took action to remedy the untenable price increases do to single family homes taking a disproportionate amount of city land and services. They hope a wider range of housing, and more housing, will reduce housing costs in the future.
Read the full story from Bloomberg News.
Interview with Aaron Clausen, AICP; City of Beverly, Director, Planning and Community Development
Rather than express generalized worry about the “lack of affordable housing”, Peabody, Salem and Beverly have created an intermunicipal Memorandum of Mnderstanding (MOU) to very specifically define and target the problem and the population they want to address.
According to Aaron Clausen, “There is a fair amount of context that goes along with the MOU, but primarily the communities got together as sort of a coalition to survey and understand what was going on relative to homelessness. What came out of that is a recognition that there is not enough affordable housing generally, and particularly transitional housing, or more specifically permanent supportive housing.
“Salem and Beverly both have shelters, however the shelters were basically serving as permanent housing (and running out of space). That won’t help someone into a stable housing situation. Anyway, this was the agreement (attached MOU) and the good news is that it has resulted in affordable housing projects; one is done in Salem for individuals and Beverly has a 75 unit family housing project permitted and seeking funding that has a set aside for families either homeless or in danger of becoming homeless.
“There is also a redevelopment of a YMCA in downtown Beverly that will increase the number of Single Room Occupancy units. I wouldn’t say that the MOU got it done by itself but it helps demonstrate a regional approach. ”
To see the actual Memorandum of Understanding between these three municipalities to address affordable housing, particularly for people who are homeless or at risk of homelessness, click HERE.
Massachusetts’ 2020 Economic Development Bill included a set of housing choice provisions: these require communities served by the MBTA to provide a district of reasonable size where multi-family housing is allowed by right. The law gives us significant flexibility to design a district that best suits our needs, but the district must allow housing suitable for families with children, without age restrictions, and at a rate of at least 15 dwelling units per acre. Arlington is one of 175 MBTA communities in Massachusetts that share in the responsibility for meeting these requirements.
The law requires a “district of reasonable size”, but what does that mean? Throughout much of 2021 the Massachusetts Department of Housing and Community Development (DHCD) worked on a set of supporting regulations that set the district requirements according to the type of transit service a community has, the number of existing homes in the community (as of the 2020 Census), and the amount of developable land near transit stations. The specifics vary by community, but here is what the requirements mean for Arlington:
- Our district needs a capacity of (at least) 2,046 homes. This isn’t a requirement to build 2,046 additional homes; instead, it reflects the total number of homes that district might contain in the future. For example, if a parcel with a two-family home were rezoned to allow a three-family home, that single parcel would have a capacity of three.
- Our district needs to allow multi-family housing by right. “By right” means that the development only requires a building permit, where the Building Inspector determines whether the project complies with zoning and building codes. While Arlington allows multi-family housing (three or more dwellings on a single parcel) in some areas, such projects are not allowed by right.
- Our district needs to allow (at least) 15 dwellings/acre. This is more or less in line with the density of the streetcar suburbs that were built in East Arlington during the 1920s. Although portions of Arlington likely meet the density requirement, none of these areas currently comply, as they don’t allow multi-family housing to be built by right.
- Our district needs to be at least 32 acres, but it could be larger. We have flexibility here, as we’ll discuss in a moment.
- Finally, due to the lack of developable land around the Alewife T station, Arlington is free to locate its multi-family district (or districts) anywhere in town. We’re not tied to any particular geographic location.
The new law’s requirements provide Arlington with a great deal of flexibility. We’re free to place our district (or districts) anywhere in town, and we’ll be able to choose from a variety of options as long as they meet the requirements set forth above. For example, providing the capacity of 2,046 homes in the minimum district size of 32 acres would give us a density of 64 dwellings/acre; roughly the scale of mid-rise apartment buildings. On the other hand, if we went with the minimum density of 15 dwellings/acre, we’d have a 135 acre district that allowed smaller multi-family homes. Our district can be anywhere within this range; we also have the option of having multiple districts, with smaller multi-family buildings in some areas of town and larger multi-family buildings in others.
Arlington has a track record of producing thorough and comprehensive planning documents, such as our Master Plan, Net Zero Action Plan, Sustainable Transportation Plan, and Housing Production Plan. These plans contain plenty of building blocks that could be used to formulate a compliant multi-family district. Viewed in that light, the MBTA community requirements are an opportunity to meet some of the goals we’ve already set for ourselves; we just have to go about it in a way that satisfies the law’s new requirements.
Arlington has one unique consideration, which doesn’t apply to most MBTA communities. In 2020, Arlington’s Town Meeting sent a home rule petition to the state legislature, asking for permission to regulate the use of fossil fuels in new building construction; it’s an important component of our plan to become carbon-neutral by 2050. A number of other communities in the Commonwealth filed similar petitions, and the legislature responded by establishing a pilot program: ten cities and towns will be allowed to enact “fossil fuel bans”, but only if they (a) have 10% subsidized housing, (b) achieve safe harbor via compliances with an approved housing production plan, or (c) establish a multi-family district of reasonable size by February 2024. Arlington doesn’t meet the subsidized housing requirement (only 6.54% of our homes are on the subsidized housing inventory), and we’re unlikely to gain safe harbor status during the next year; our most viable path to participation hinges on meeting the multi-family requirements.
In summary, the multi-family requirement for MBTA communities creates new requirements for Arlington, while also presenting us with new opportunities: the opportunity to meet planning goals, the opportunity to meet sustainability goals (e.g., by regulating fossil fuel use in new construction), and the opportunity to reimagine how we do multi-family housing in Arlington as our town moves forward into the twenty-first century.
A few days ago, the Boston Globe ran an article titled “2021 set records in Boston Housing Market. What now?“. It’s not unusual to see stories about housing in the news — the market is highly competitive and the sale prices can be jaw dropping. Jaw dropping can take several forms: from the new (and used) homes that sell for over two million dollars, to the amount of money that someone will pay to purchase a small post-war cape (around $900,000, give or take).
According to the globe article, the Greater Boston Association of Realtors estimates that the median price of a single family homes in the Boston area rose 10.5% in 2021, to $750,000. Arlington is comfortably in the upper half of this median: according to our draft housing production plan the median sale price of our single family homes was $862,500 in 2020, and rose to $960,000 in the first half of 2021 (see page 39).
In June 2021, I got myself into a habit of sampling real estate sales listed in the Arlington Advocate, and compiling them into a spreadsheet. My observations are generally consistent with the sources cited above; Arlington’s housing is expensive and it’s appreciated rapidly, particularly in the last 6–10 years. It’s a great time for existing owners, but less so if you’re in the market for your first home.
We’re actually facing two problems, which are related but not identical. The first is high cost, which creates financial stress and a barrier to entry (though it is a boon for those who sell). The second problem is quantity; there are regional and national housing shortages, and that contributes to high prices and bidding wars.
Addressing these challenges will require collective effort on behalf of all communities in the metro area; this is a regional problem and we’ll all have to pitch in. There isn’t a single recipe for what “pitching in” means, but here are some for what communities can do.
First, produce more affordable housing. Affordable housing is a complex regulatory subject, but it basically boils down to two things: (1) the housing is reserved for households with lower incomes than the area as a whole, and (2) there’s a deed restriction (or similar) that prevents it from being sold or rented at market rates. Affordable housing usually costs more to produce than it generates in income, and the difference has to be made up with subsidies. It takes money.
Second, simply produce more housing. This is the obvious way to address an absolute shortage in the number of dwellings available. Some communities have set goals for housing production. Under the Walsh administration, Boston set a goal of producing 69,000 new housing units by 2030. Somerville’s goal is 6000 new housing units, and Cambridge’s is 12,500 (page 152 of pdf). To the best of my knowledge, Arlington has not set a numeric housing production goal, but it’s something I’d like to see us do.
Finally, communities could be more flexible with the types of housing they allow. Arlington is predominantly zoned for single- and two-family homes. The median sale price of our single family homes was $960,000 during the first half of 2021, and a large portion of that comes from the cost of land. That’s the reality we have, and the existing housing costs what it costs. So, we might consider allowing more types of “missing middle” housing, where the per dwelling costs tend to be lower: apartments, town houses, triple-deckers, and the like.
Of course, this assumes that our high cost of housing is a problem that needs to be solved; we could always decide that it isn’t. In the United States, home ownership is seen as a way to build equity and wealth. It’s certainly been fulfilling that objective, especially in recent years.
Two weeks ago, I helped to organize a precinct meeting for residents and town meeting members. During the meeting, we got into a discussion about public open spaces, how the town funds their upkeep, and whether having more commercial tax revenue might provide additional funding for parks and recreation.
As I discussed in an earlier post, only about 5.6% of Arlington’s is zoned for commercial uses, and that limits the amount of commercial property tax revenue we can generate. Commercial property tax revenue is sometimes referred to as “CIP”, which stands for “Commercial, Industrial, and Personal”. Commercial and Industrial refer to property taxes on land and buildings that are respectively used for commercial and industrial uses. Personal tax is tax on the value of equipment that’s owned and used by a business for the purpose of carrying out whatever their business is. This could include things like desks, display fixtures, cooking equipment, fork lifts, and the like.
In 2020, Arlington’s CIP levy was 5.45%, meaning that 5.45% of our property tax revenue came from Commercial, Industrial, and Property tax revenue. Breaking this down further, 4.2% was commercial ($5,562,528 tax levy), 0.2% was industrial ($278,351 tax levy), and 1.1% was personal ($1,423,117 tax levy). The town’s total 2020 tax levy was $133,350,155. This data comes from MassDOR’s Division of Local Services, and I’ll provide more specific sources in the “References” section of this post.
A CIP levy of 5.45% is low (compared with other communities in the commonwealth), and occassionaly folks like to talk talk about how to raise it. Which is to say, we about how to raise the ratio of commercial to residential taxes. I moved to Arlington in 2007, when our CIP levy was 5.37%. This increased in subsequent years, peaking at 6.26% in 2013, and has been gradually decreasing since. Recall that 2008 was the year the housing market crashed, and the “great recession” began. The value of Arlington’s residential property fell, but the value of business properties was relatively stable in comparison. Thus, our CIP percentage got a boost for a couple of years.
Tax levies (the amount of tax collected) are a direct reflection of the tax basis (the assessed value of property). I’m going to shift from talking about the former to talking about the latter, because that will lead nicely to a discussion about property wealth. Which is to say, the aggregate value of property assessments in town.
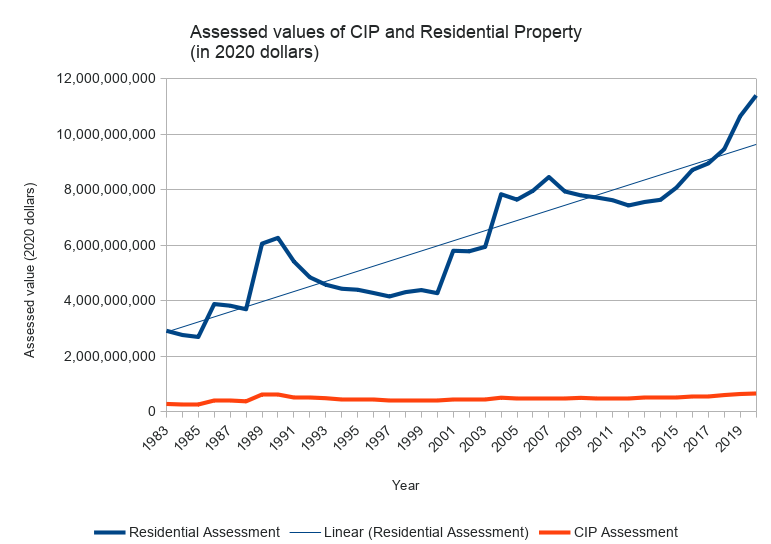
Here’s a chart showing Arlington’s net CIP and residential property values, from 1983–2020, adjusted to 2020 dollars. (This is similar to the chart that appears on page 102 of Arlington’s Master plan, but for a longer period of time).
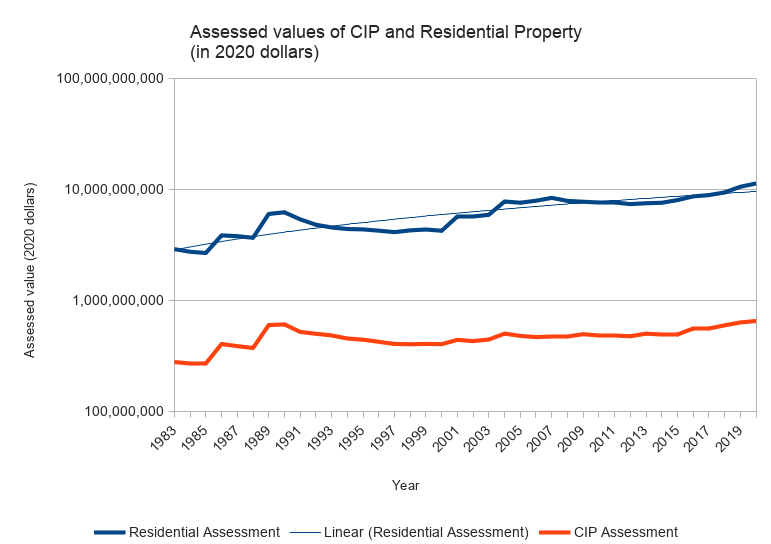
Generally speaking, the value of Arlington’s residential property has appreciated considerably, and there’s a widening gap between our residential and CIP assessments (in terms of raw dollars). Because the gap is so large, it’s helpful to see it on a log scale.
Viewed this way, the curvatures are generally similar, but residential property wealth is rising faster than business property wealth.
In summary, there are three reasons why our CIP is as low as it is: (1) a limited amount of land where one can run a business, (2) the value of residential property is appreciating faster than the value of business property, and (3) occasionally business properties are converted to residential (perhaps with the residential property being worth more than the former business property). That’s not to say we can’t improve the commercial tax base. We can, but we will have to think about what and where, and how to compete with a generally competitive residential market.
References
- MassDOR Division of Local Services reports
- DOR Query Tool for Municipal Property Assessments
- DOR Query Tool for Municipal Tax Levies
- Spreadsheet of Arlington Property Assessments, 1983–2020. Data obtained from MassDOR, with calculations added to adjust for inflation.
- Spreadsheet of Massachusetts Property assessments for 2020. Data obtained from MassDOR.
(Updated 7/2/2020, to add log scale graph and revise conclusion.)
As the public hearings on the zoning articles proceeded in late winter and early spring, 2019, it became clear that there was a very strong sentiment that the proposed increase in density in these designated zoning districts should result in an increase in affordable housing in Arlington. This coincided with the approved 2015 Master Plan’s stated goals:
- Encourage mixed-use development that includes affordable housing, primarily in well-established commercial areas.
- Provide a variety of housing options for a range of incomes, ages, family sizes, and needs.
- Preserve the “streetcar suburb” character of Arlington’s residential neighborhoods.
- Encourage sustainable construction and renovation of new and existing structures (see ch. 5, pg 77++ for housing section)
- The Yes on 16 report supports the citizen initiated petition resulting in Article 16 and demonstrates the tremendous impact of rapidly increasing land values on the overall affordability of property in Arlington. Building a stack of homes on one footprint is far more financially affordable than creating a single home on the same footprint of land.
(This post was originally an email message, discussion open space changes proposed by an Affordable Housing article during the Arlington, MA’s 2019 town meeting. It’s also a decent description of our town’s open space laws.)
Sorry this turned out to be a long post. Our open space laws are kind of complicated.
Arlington regulates open space as a percentage of gross floor area, rather than as a percentage of lot area. Let me give a concrete example: say we have a-one story structure with no basement. It covers a certain percentage of the lot area, and has an open space requirement based on the gross floor area (i.e., the interior square footage of the building).
Now, suppose we want to turn this into a two- or three-story structure. The building footprint does not change, and it covers exactly the same percentage of the lot area. However, the open space requirements double (if you’re doing a two-story building), or triple (if you’re doing a three story building). If that quantity of open space isn’t on the lot, then you can’t add the stories.
For this reason, I’d argue that our open space regulations are primarily oriented to limiting the size of buildings. You really can’t allow more density (or taller buildings) without reducing the open space requirements. Alternatively, if the requirements were based on a percentage of lot area, we probably wouldn’t need a reduction. (Cambridge’s equivalent is “Private Open Space”, and they regulate it as a percentage of lot area.)
The other weird thing about our open space laws is that we define “usable open space” in such a way that it’s possible to have none. (Usable open space must have a minimum horizontal dimension of 25′, a grade of 8% or less, and be free of parking and vehicular traffic). I live on a nonconforming lot that does not meet these requirements, as do the majority of homes in my neighborhood.
Suppose I wanted to build an addition, which would increase the gross floor area. With the non-conformity, I’d have to go in front of the ZBA and show that the current lot has 0% usable open space, and that the house + addition produces a lot with 0% usable open space. Because 0% = 0%, I have not increased the nonconformity, and would be able to build the addition, provided that all of the other dimensional constraints of the bylaw are satisified. Although this isn’t directly related to Article 16, it’s an amusing side effect of how the bylaw is written.
Finally, roofs and balconies. Section 5.3.19 of our current ZBL allows usable open space on balconies at least six feet wide, and on roofs that are no more than 10′ above the lowest occupied floor. We allow 50% of usable open space requirements to be satisfied in this manner.
The relevant section of Article 16 would create a 8.2.4(C)(1) which includes the language
Up to 25% of the landscaped open space may include balconies at least 5 feet by 8 feet in size only accessible through a dwelling unit and developed for the use of the occupant of such dwelling unit.
Article 16’s incentive bonuses strike the usable open space requirement, and double the landscaped open space requirement. With only landscaped open space, 5.3.19 doesn’t apply (it only pertains to usable open space). The language I’ve quoted adds something 5.3.19-like, but for landscaped open space. I say 5.3.19-like because it has a 25% cap rather than a 50% cap, and requires eligible balconies to be at least 5’x8′, rather than 6′ wide.
Here are a few pieces of supporting documentation:
- definitions of landscaped and usable open space from our ZBL
- a diagram to illustrate the difference between landscaped and usable open space.
- The text of section 5.3.19 (which is referenced by the diagram)
- the main motion for Article 16