The citizen participation process including presentations, discussions, public hearings, letters and comments has been long and arduous. The issues are complicated and sometimes feelings run high. In such situations, there can be a feeling that citizens have not been heard. This document, “Guide to Zoning Amendments Related to Multifamily Uses and Mixed-Use“, summarizes many of the issues that have been raised and the changes that have been made in the zoning Articles as a result of the citizen participation in the public review process. Citizens have been heard.
Related articles
This is the second in a series of “Arlington 2020” articles. The first article looked at the number of one-, two-, and three-family homes and condominiums in Arlington, and how that housing stock has changed over time. This article will examine changes in the value of those properties. We’re going to look at “value” through the lens of property assessments, so we should start with an explanation of what property assessments are and how they’re used.
A property assessment is simply the Town Assessor’s best estimate of what a property is worth, based on market values. The assessor’s office inspects properties every ten years; during intervening years, assessments are adjusted based on sale prices of similar homes in a given tax neighborhood. For all practical purposes, assessed values tend to trail market values by two years. In my neighborhood, property assessments are spot on — my house was assessed at $501,000 in 2020; during 2018, sales of similar homes in the neighborhood ranged from $495,000 to $520,000.
Condominiums have a single assessed value, which includes land and buildings. Otherwise, assessed values are broken down into land value, building value, and yard items (e.g., a garage or a shed).
Assessed values are used to determine the tax rate. The assessors page on the town website has calculations in worksheet form, but for all practical purposes, it’s just a division problem. One takes the total tax levy and divides by the sum of all property assessments (in thousands of dollars), and that’s the tax rate. An individual’s taxes are the assessed value of their property (in thousands of dollars) multiplied by the tax rate. If an individual owns (say) 1% of the assessed value in town, that individual will pay 1% of the property tax levy.
The main point is that assessed values are based on market values, but with a two-year lag. Consequently, we can use them as a way to see how home prices have changed over time.
With that background information out of the way, we can look at some numbers. Here’s a graph of the median assessed values for condominiums, one-family, two-family, and three-family homes from 2013 through 2020. (the “median” is a value such that half of the assessments are above, and half are below).
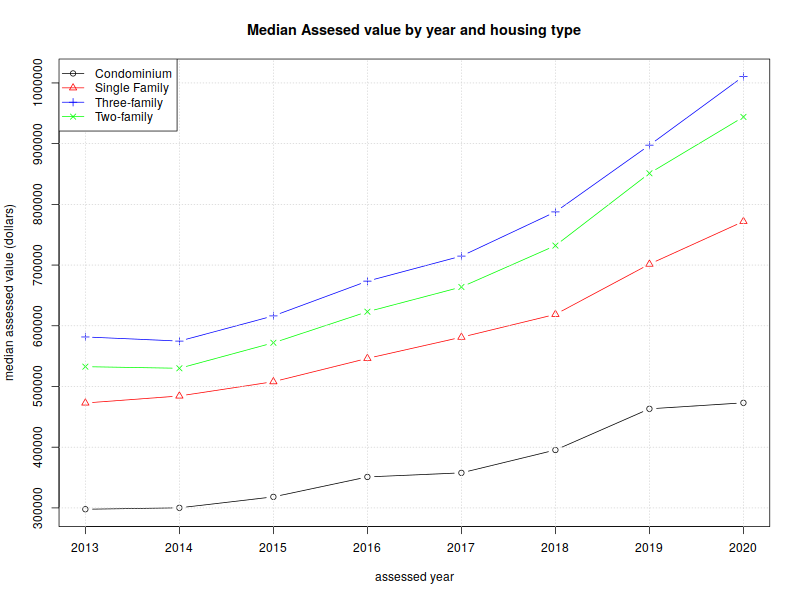
| year | Condominium | Single Family | Two-family | Three-family |
| 2013 | $297,800 | $472,850 | $532,650 | $581,600 |
| 2014 | $300,150 | $484,400 | $530,000 | $574,800 |
| 2015 | $318,200 | $507,900 | $572,000 | $616,300 |
| 2016 | $351,050 | $546,300 | $623,150 | $673,550 |
| 2017 | $357,750 | $581,200 | $663,900 | $714,800 |
| 2018 | $395,400 | $618,800 | $732,100 | $787,600 |
| 2019 | $463,250 | $701,550 | $851,200 | $897,500 |
| 2020 | $473,100 | $771,900 | $944,000 | $1,010,850 |
| %change | 58.87% | 63.24% | 77.23% | 73.81% |
As one would expect, two-family homes are worth more than single-family, and three-family are worth more than two. Condominiums have a lot of variety; they could be half of a duplex, or a single unit in an apartment building. But a general upward trend is clearly evident.
These values are straight out of the assessor’s database, and not adjusted for inflation. The Bureau of Labor Statistic’s inflation calculator shows 12% inflation between 2013 and 2020; the %change is pretty considerable, even if one deducts 12% for inflation.
Next, I’d like to dig further into the 1–3 family assessments, by breaking them down into the value of land vs the value of buildings, and showing how that’s changed over time.
Single-family homes:
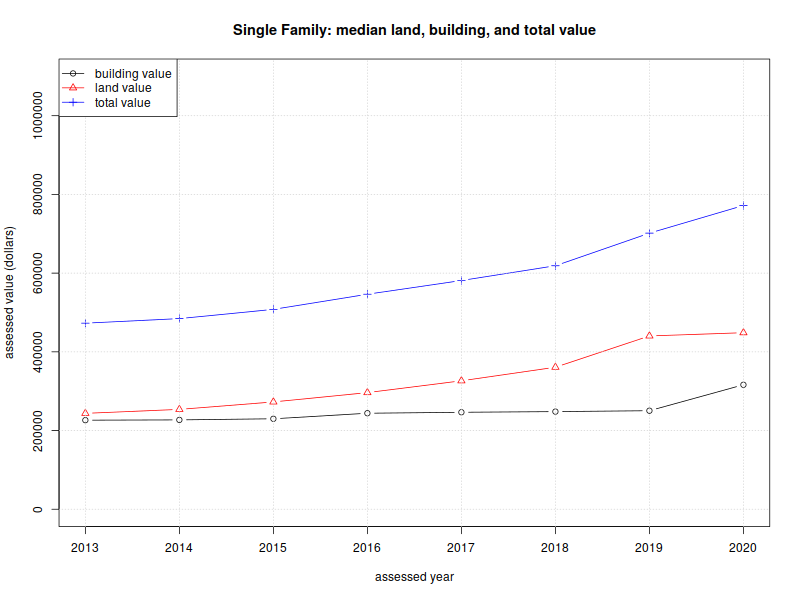
| year | Land value | Building value | Total assessed value |
| 2013 | $243,700 | $226,300 | $472,850 |
| 2014 | $253,750 | $227,050 | $484,450 |
| 2015 | $272,700 | $229,900 | $507,900 |
| 2016 | $296,400 | $243,950 | $546,400 |
| 2017 | $326,400 | $246,400 | $581,250 |
| 2018 | $360,900 | $248,100 | $618,800 |
| 2019 | $440,400 | $250,400 | $701,600 |
| 2020 | $448,600 | $316,300 | $771,900 |
| %change | 84.08% | 39.77% | 63.24% |
Two-family homes:
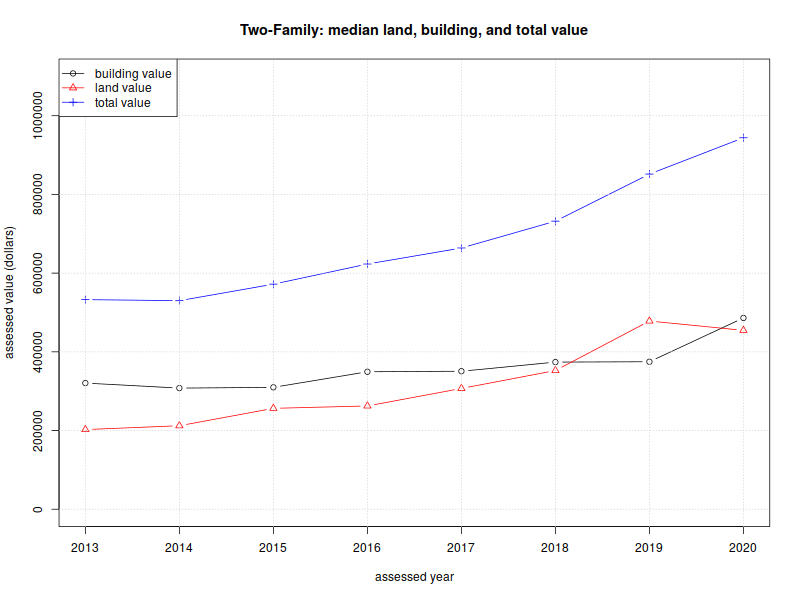
| year | Land value | Building value | Total assessed value |
| 2013 | $202,500 | $320,550 | $532,650 |
| 2014 | $212,250 | $307,800 | $530,000 |
| 2015 | $256,400 | $309,800 | $572,000 |
| 2016 | $262,500 | $349,400 | $623,150 |
| 2017 | $307,000 | $350,700 | $663,900 |
| 2018 | $352,500 | $373,900 | $732,100 |
| 2019 | $478,300 | $374,850 | $851,700 |
| 2020 | $454,500 | $486,100 | $944,000 |
| %change | 124.44% | 51.65% | 77.23% |
Three-family homes:
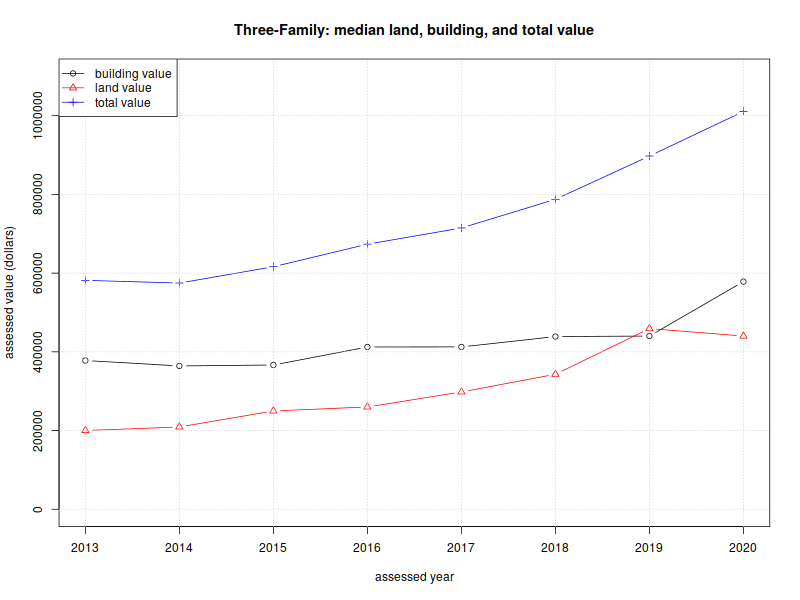
| year | Land value | Building value | Total assessed value |
| 2013 | $200,100 | $377,900 | $581,600 |
| 2014 | $209,100 | $364,100 | $574,800 |
| 2015 | $249,800 | $366,550 | $616,300 |
| 2016 | $259,950 | $412,350 | $673,550 |
| 2017 | $298,100 | $412,500 | $714,800 |
| 2018 | $343,050 | $438,800 | $787,600 |
| 2019 | $459,000 | $440,100 | $897,500 |
| 2020 | $440,100 | $578,450 | $1,010,850 |
| %change | 119.94% | 53.07% | 73.81% |
There are several things worth pointing out in these breakdowns.
First, note that the land and building values “jump” a bit between 2019–2020. 2020 was one of our full reassessment years, so I’m willing to attribute this to a periodic course correction. The total increase is generally linear, but the land/building composition has changed.
Second, the median land value for single-family homes is higher than the median building value, for all years between 2013–2020.
Third, most of the increases come from changes in land value. I believe this comes down to location, location, and location. Arlington has a well-respected public school system, and it’s close to universities and tech centers is Cambridge and Boston, and office parks in Lexington, Waltham, and Burlington. City amenities are close at hand.
So what does one do about our rising home prices, and in particular, the rising value of land? The first (and perhaps default) answer is to do nothing. Rising property values are a boon to homeowners who purchased a capital asset (i.e., a house) in the past, and have seen its value appreciate over time. The downside of doing nothing is that each year, increasing housing prices create an ever-increasing income threshold for new residents.
An alternative approach would be to allow more (and smaller) units to be built on each lot. This requires reconstruction or redevelopment, but it allows the cost of land to be amortized among several households. More units/lot means more people and more density, but it reduces the income threshold for buying in to Arlington. (Note that the per-unit cost for three-family homes is lower than the per-unit cost for two-family homes. Similarly, the per-unit cost for two-family homes is lower than the cost of a single-family home).
A third article will look at the distribution of housing prices in Arlington, and how the distribution varies by housing type.
Here is a spreadsheet of data shown in this post.
from Karen Kelleher, Reporter
Interested in new policy developments on housing production in the Greater Boston area? The latest research from Mass Housing Partnership (MHP) is of interest. They just released (Dec. 18, 2019) in interactive map showing relative housing density around every mass transit and commuter rail station in the system, concluding that the region could add 235,000 units if every community allowed density as of right in the area around transit.
CHAPA has legislation pending that would require municipalities served by transit to allow higher density as of right within a certain distance from transit stations. You’ll see that the density around Alewife is not too bad in the context of the entire system.
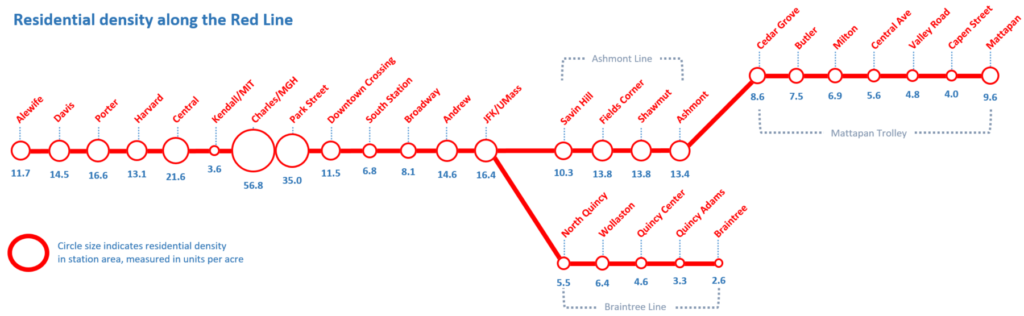
This is mostly because of very high density in Cambridge near Alewife, but the density of two and three families in East Arlington shows better housing density than the sea of single family zoning around many commuter rail stops.
You can check it out here:https://www.mhp.net/news/2019/todex-research-brief
(DRAFT – 7/11/2019)
Overview
Arlington Planning Department officials report on options for the Town to mitigate the effects of housing demolitions and housing replacements in neighborhoods.
Evidence suggests that lack of appropriate regulatory policies have led to incidences of “mcmansions” and other issues that concern neighborhood residents. This study looks at the data, the policy and regulatory options for Arlington. It also looks at how comparable nearby communities have managed similar circumstances.
This 42 page report covers a great deal of data and analysis of homes by zoning district, gaps in the effectiveness of the current regulatory structure, affects on affordability in Arlington by zoning district, information on housing prices and sales, etc.
“Best practices” include descriptions of demolition delay, expansion of local historic districts, neighborhood conservation districts, design review standards and guidelines and possible revisions to the regulatory framework in Arlington. The report also includes interesting case examples of how comparable communities near Arlington handle these issues.
This report was presented to the Arlington Select Board on July 22.
Read the complete report and see the available data and tables.
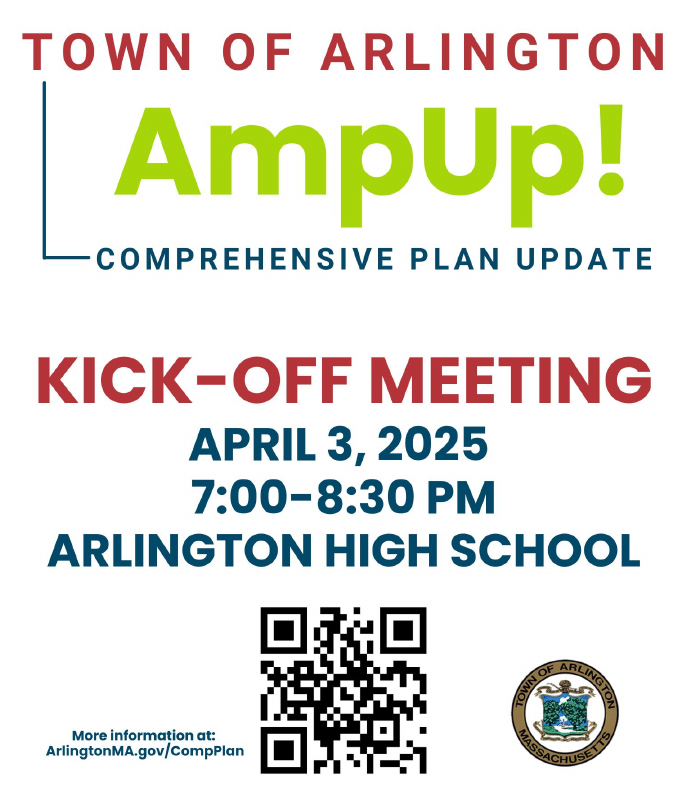
The kick-off event for updating Arlington’s Comprehensive Plan (formerly called the Master Plan) is just around the corner on April 3rd from 7-8:30 PM in the Arlington High School Cafeteria!
A Comprehensive Plan is a long-range plan for the Town, and an opportunity for the community to come together and imagine what Arlington could look like in ten or fifteen years. It covers things like housing, business development, parks and open spaces, town services and facilities, and transportation. The kickoff meeting is the first step in building that vision.
Arlington residents of all ages are invited to attend this event, where you can expect a presentation followed by small group discussions. The effort will continue throughout the year, and it’s important to hear from as many residents as possible. Please join if you can!
For more information and to add the meeting to your calendar, see ArlingtonMA.gov/CompPlan.


by Beth Elliott
I’m a member of the Affordable Housing Trust Fund Board and an attorney with over 15 years of practice in affordable housing law. Views expressed are my own, not those of the Trust.
The Town of Arlington and the Arlington Affordable Housing Trust Fund have created the Acquisition, Creation and Conversion (ACC) Program to provide a flexible source of funding for creating deed-restricted affordable housing in Arlington. Up to $250,000 is available per restricted unit, and the Town has dedicated federal ARPA funds to support the ACC Program.
ACC Program funds can be used to build new deed-restricted affordable units, whether rented or owned. ACC funds can only be used for existing units if the current tenants will not be displaced.
“Deed-Restricted” Is Important
“Deed-restricted” is the key component here. Housing that is “deed-restricted” as affordable housing is protected by a legally binding agreement that is recorded against the property in the registry of deeds. This agreement specifies the levels of affordability that must be maintained and for how long. It’s a public commitment to provide affordable housing that binds the current owner of the property as well as anyone else who buys the property while the restriction is in place. The ACC Program requires affordability for at least 20 years for rental units and in perpetuity for homeownership units. For rental properties, this means that tenants know that their units will remain affordable for the long term, even if their landlord changes.
Personally, I’m most excited about the potential to use the ACC Program to apply these protections to existing naturally occurring affordable housing in Arlington. For example, if an owner of an existing apartment building participates in the ACC Program, some or all of the apartment units will become deed-restricted affordable housing. Because ACC Program funds can only be used if the existing tenants aren’t displaced, this locks in deed-restricted affordability for the existing tenants. This innovative feature of the program is rare in my experience of affordable housing programs, and it has RFP potential to make meaningful change for existing tenants of naturally occurring affordable housing.
Get the Full Rules
In addition, the ACC Program can be combined with other funding sources, so there is great opportunity for owners to propose their own solutions. The Request for Proposals (RFP) issued for the ACC Program, available here, provides the full rules for participating in the program.