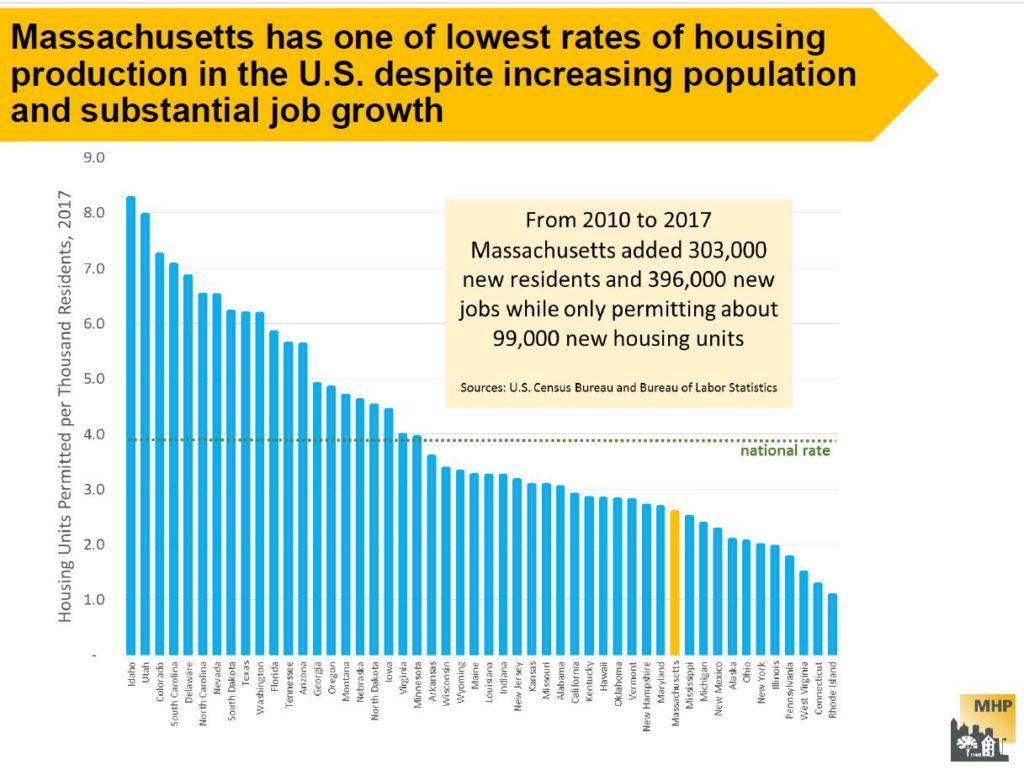
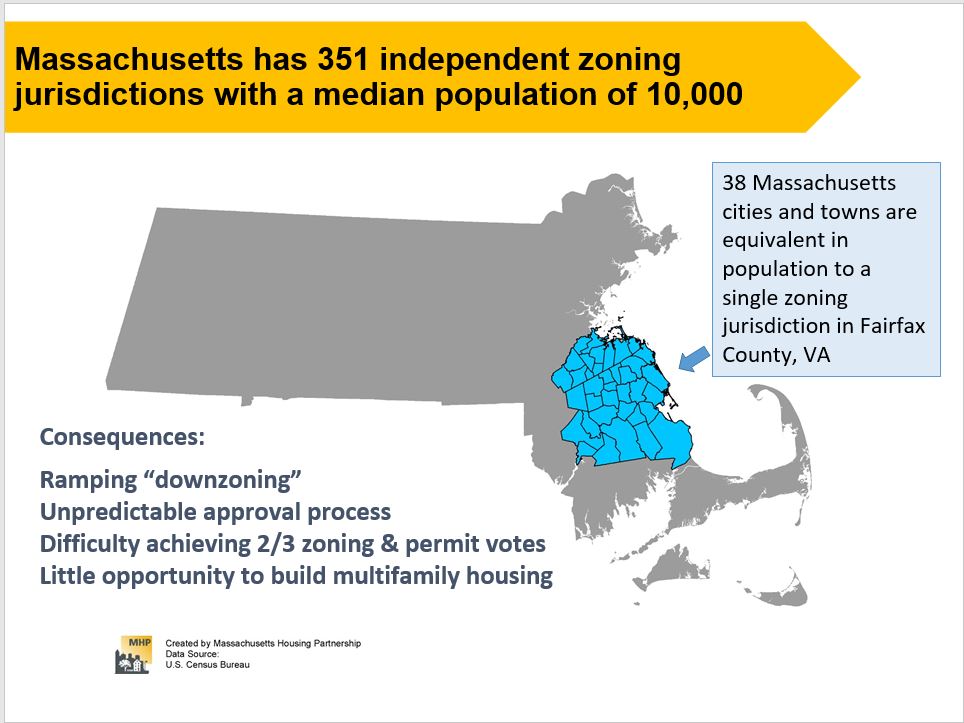
Data in a Mass Housing Partnership report shows how far behind the Boston metropolitan area has fallen in meeting the housing needs of its citizens. There are four primary categories for measuring the inadequacies: 1. Availability, 2. Affordability, 3. L0cation and Mobility and 4. Equitability. See the full report for more data and examples. Two slides are shown below.
Related articles
Equitable Arlington, along with City Life/Vida Urbana and the Harvard Legal Aid Bureau, supports the legacy tenants of 840/846 Massachusetts Avenue in their resistance to rent increases of up to 50%. We urge the buildings’ owner, Torrington Properties, to continue negotiating an agreement with the tenants rather than pursue legal action likely to end in housing court. If more gradual increases are incompatible with Torrington’s business plan, we hope to see the sale of the property to the Housing Corporation of Arlington or another buyer who is committed to keeping the existing tenants in their homes.
The property, whose two larger buildings date to 1940 and 1963, faces Arlington High School, within easy reach of shopping and transit. It occupies one of relatively few spots in Arlington where people can live without a car. (Equitable Arlington and the MBTA Communities plan seek to encourage exactly this kind of housing.) Many of the middle- and lower-income tenants have been there for decades, including teachers, musicians, and some Section 8 voucher recipients. Some are immigrants with limited English. Laura Frost, who has lived there for 20 years, describes the apartments as “unofficial,” and therefore legally unprotected, affordable housing. Erica Schwarz, executive director of the Housing Corporation of Arlington, concurs: “There are so few places where low-income tenants are in units that aren’t restricted.”
When Torrington Properties bought the buildings in 2019, it did not raise rents right away. Instead, the company pursued a familiar strategy of remodeling apartments when tenants moved out and then marketing them as “luxury” units. More recent arrivals are paying typical market rents. Of the longtime residents, several have left because they were worried about being pushed out to make way for more remodeling and steep rent increases, says Frost, who leads the tenants’ association. All have been tenants at will since Torrington bought the property, with their rents not rising but also not guaranteed by 12-month leases. In November 2022, she says, Torrington distributed a list of target rents for all of the units. A few months later, it informed legacy tenants, then about 20 in number, that they needed to either sign leases at the new rates or move out.
“Our position was never ‘You can’t raise rents ever,’” says Frost, who recognizes that Torrington can legally set rents at any level. Working with City Life/Vida Urbana, she hoped for an agreement for more gradual rent increases, like the one Torrington had just reached with tenants near Forest Hills in Boston. By last spring, however, negotiations had broken down. A rally she organized in September drew Reps. Garballey and Rogers. In February, Torrington sent the legacy tenants notices to quit. We are encouraged that negotiations have since resumed. At the same time, we support a more sustainable option for these tenants and anyone who lives there in the future, as well as Arlington as a whole: a commitment, perhaps by a new owner, to keeping some units affordable in the long term.
Schwarz, of the Housing Corporation of Arlington, has discussed purchasing the property from Torrington, which named a price she describes as “a few million dollars more” than HCA can offer. She has been exploring alternative ways to structure a purchase. This would include drawing on the Town of Arlington’s ARPA funds, as well as seeking mission-aligned equity partners for the project under a “mixed income” model. This would not displace any current tenants, but would, over time, provide a very high percentage of affordable units at a range of income levels, while also providing middle-income and market rate units.
Equitable Arlington supports common-sense reforms that allow for more housing options and tenant protections for current and future Arlington residents. We support increased funding for affordable housing, both through the Affordable Housing Trust Fund and state and federal subsidies, and a wider range of housing choice for every income level and every life stage. We also champion housing that is sustainable, equitable, and accessible, including locating additional housing near public transportation, all of which we believe will make Arlington an even more welcoming community.
A portion of Envision Arlington’s town day booth was designed to spark a community conversation about housing. Envision set up a display with six poster boards, each representing a housing-related topic. Participants were given three dots and asked to place them on the topics they felt were most important. There were also pens and post-it notes on hand to capture additional comments. This post is a summary of the results. You could think of it as a straw-poll or temperature check on the opinions of town day attendees.
Social Justice Issues
Aiming for a diverse population by income and race; and being vigilant about identifying and neutralizing barriers to this goal.
197 dots, plus a post-it note that reads “Increasing housing while preserving open space” (with three dots).
Lifestyle Options
Providing for different lifestyles: empty nesters, single millenials, young parents, families, walkable neighborhoods.
149 dots and four post-it notes:
- No more new 5-story buildings with no setbacks. Ugly. (3 dots)
- Why must we maintain our high carbon footprint with single family homes and cars?
- I want to live in a wofati (eco building) (Woodland Oehler Freak-Cheap Annualized Thermal Intertia). Not so legal, one day the norm. Thank you Arlington.
- Connect to transit. Less single family housing with dedicated parking.
Housing Affordability
Affordable housing from subsidies, from construction of smaller units, or from building more housing to reduce the bidding price on current Arlington homes.
308 dots, with 10 post-it notes
- We don’t need more housing. People need to be able to afford to stay in their homes.
- Get Arlington out from the clutches of real estate lobby. (1 dot)
- Wrong categories. Includes affordable housing and development which displaces low and moderate income housing
- Restrictions on teardowns of small homes
- Keep older apartment buildings. They are cheap and affordable.
- Rent control and oversight. “I can only afford to stay because I live in a place that is not secure and in disrepair.”
- Rent control. Please reinstate so that rent is affordable.
- “Affordable” subsidized housing invades your privacy. Every year need all bank stubs, 401(k), like a criminal.
- Build more housing. Build more duplexes, triplexes, etc. Upzone neighborhoods. More transit corridors. Renew calls for a red line stop. Build up the downtown to encourage more density and housing in the same buildings as businesses. More housing + transit = a better society.
- Protect neighborhoods
This was clearly the topic that drew the most response. Arlington housing is expensive.
Maximizing Flexibility of Home Space
Providing for aging parents or childcare providers with a place in your home or getting help paying the mortgage by having a rentable space.
81 dots, and three post-it notes:
- Change zoning to allow accessory dwelling apartments (aka ADUs, granny flats, in-law apartments) (1 dot)
- Want nearby widowed mom to live in own house.
- Accessible rentals, not up 3 flights of stairs.
Doing more with Existing Resources
Examining current Arlington Housing Authority, Housing Corporation of Arlington, and aging apartment buildings for addressing new housing needs.
143 dots, and five post-it notes:
- Fix transportation infrastructure. Peope can live farther out and still get to work. (4 dots)
- Extend red line to Arlington center and heights. (7 dots)
- None of the above. Keep taxes low. (1 dot)
- Accessible for aging residents. Age in place.
- Do something about empty store fronts.
Setting a ten-year goal for new housing
Determining what Arlington’s housing goals should be, and setting about following through on the necessary zoning and incentives to get what we want.
119 dots, and three sticky notes:
- Why is America low-density? Why is this country slave to the auto? More housing near transit!
- Who is “we”?
- There is too much housing density now. Need business area to attract business.
Observations
As noted earlier, the cost of housing seemed to be the main issue of concern. This is understandable: housing prices in Arlington (and the region in general) have been on an escalator ride up since about 2000 or so. That’s led to our current high cost of housing, and also to a form of gradual gentrification. When housing is more expensive than it was last year, a new resident in town has to make more money (or be willing to spend more on housing) than last year’s new resident.
I see at least two broad responses to this: one is to keep the status quo, perhaps returning to the inexpensive housing of decades past. The other is for more multi-family housing, and more transit-oriented development. It will be interesting to see how these dynamics play out in the future.
There’s also recognition of the importance of older “naturally affordable” apartment buildings. Arlington was very pro-growth in the 1950s and 1960s; that’s fortunate, because it allowed these apartments to be built in the first place. On the downside, we haven’t done a good job of allowing new construction into the pipeline during recent decades. Buildings depreciate, so a new building is worth more than one that’s ten years old, which is worth more than one that’s twenty years old, and so on. At some point, the old apartments are likely to be refurbished/upgraded, and they’ll become more expensive as a result.
This is only the beginning of the conversation, but at least we’re getting it going.
(Barbara Thornton, Arlington and Roberta Cameron, Medford)
Our communities need more housing that families and individuals can afford. From 2010 to 2017, Greater Boston communities added 245,000 new jobs but only permitted 71,600 new units of housing. Prices are escalating as homebuyers and renters bid up the prices of the limited supply of housing. As a result, one quarter of all renters in Massachusetts now spend more than 50% of their income on housing. (It should be only about 30% of monthly gross income spent on housing costs.) Municipalities have been over-restricting housing development relative to need. The expensive cost of housing not only affects individual households, but also negatively affects neighborhoods and the region as a whole. Lack of affordability limits income diversity in communities. It makes it harder for businesses to recruit employees.
Over the last two years, researcher Amy Dain, commissioned by the Massachusetts Smart Growth Alliance, has systematically reviewed the bylaws, ordinances, and plans for the 100 cities and towns around Boston to uncover how local zoning affects multifamily housing and why local communities failing to provide enough additional housing to keep the prices from skyrocketing for renters and those who want to purchase homes.
Interested in housing affordability and why the cost of housing is increasing so dramatically to prevent average income residents from affording homes in the 100 municipalities around Boston? Arlington and Medford residents are pleased to welcome author Amy Dain to present her report, THE STATE OF ZONING FOR MULTIFAMILY HOUSING IN GREATER BOSTON (June 2019). Learn more about the so-called “paper wall” restricting production, common trends in local zoning, and best practices to increase production going forward. Learn about efforts in Medford and Arlington to increase housing production and affordable housing and how you can get involved. Thursday, July 25, 2019, 7:00 PM at the Medford Housing Authority, Saltonstall Building, 121 Riverside Avenue, Medford. (Parking is available.)
To access the full report, go to: https://ma-smartgrowth.org/wp-content/uploads/2019/06/03/FINAL_Multi-Family_Housing_Report.pdf
The Massachusetts Smart Growth Alliance, which commissioned the study, provides the following summary of the four principal findings and takeaways:
1) Very little land is zoned for multi-family housing.
For the most part, local zoning keeps new multi-family housing out of existing residential neighborhoods, which cover the majority of the region’s land area.
In addition, cities and towns highly restrict the density of land that is zoned for multi-family use via height limitations, setbacks, and dwelling units per acre. Many of the multi-family zones have already been built out to allowable densities, which mean that although multi-family housing is on the books, it does not exist in practice.
At least a third of the municipalities have virtually no multi-family zoning or plan for growth.
Takeaway: We need to allow concentrated density in multi-family zoning districts that are in sensible locations and allow for incremental growth over a larger area.
2) We are moving to a system of project-by-project decision-making.
Unlike much of the rest of the country, Massachusetts does not require communities to update their zoning on a regular basis and make it consistent with local plans. Although state law ostensibly requires municipalities to update their master plans every ten years, the state does not enforce this provision and most communities lack up-to-date plans.
Instead, the research documents a trend away from predictable zoning districts and toward “floating districts,” project-by-project decision-making, and discretionary permits. Dain found that 57% of multi-family units approved in the region from 2015-2017 were approved by special permit, 22% by 40B (including “friendly” 40B projects), 7% by use variance, and only 14% by “as-of-right” zoning.
There also seems to be a trend toward politicizing development decisions by shifting special permit granting authority to City Council and town meeting. The system emphasizes ad hoc negotiation, which in some cases can achieve a more beneficial project. Yet the overall outcome is a slower, more expensive development process that produces fewer units. Approving projects one by one inhibits the critical infrastructure planning and investments needed to support the growth of an entire district.
Takeaway: We would be better served by a system that retains the benefits of flexibility while offering more speed and predictability.
3) The most widespread trend in zoning for multi-family housing has been to adopt mixed-use zoning.
83 of out of 100 municipalities have adopted some form of mixed-use zoning, most in the last two decades. There is a growing understanding that many people, both old and young, prefer to live in vibrant downtowns, town centers and villages, where they can easily walk to some of the amenities that they want. Malls, plazas and retail areas are increasingly incorporating housing and becoming lifestyle centers.
Yet with few exceptions, the approach to allowing housing in these areas has been cautious and incremental. These projects are only meeting a small portion of the region’s need for housing and often take many years of planning to realize. In addition, the challenges facing the retail sector can make a successful mixed-use strategy problematic. Commercial development tends to meet less opposition than residential development, even in mixed-use areas.
Takeaway: We need more multi-family housing in and around mixed-use hubs, but not require every project to be mixed-use itself.
4) Despite their efforts, communities continue to build much more new housing on their outskirts rather than in their town centers and downtowns.
About half of the communities in the study permitted some infill housing units in their historic centers, but her case studies show that these infill projects are modest in scale and can take up to 15 years to plan and permit.
On the other hand, many more units are getting built in less-developed areas with fewer abutters. This includes conversion of former industrial properties, office parks, and other parcels disconnected from the rest of the community by highways, train tracks, waterways or other barriers. This much-needed housing can be isolated even when dense, and still car-dependent because of limited access to public transportation and lack of walkability.
Takeaway: We need to allow more housing in historic centers as well as incremental growth around those centers. Furthermore, we need to plan an integrated approach to growth districts so that they can be better connected to the community and the region.
Two weeks ago, I helped to organize a precinct meeting for residents and town meeting members. During the meeting, we got into a discussion about public open spaces, how the town funds their upkeep, and whether having more commercial tax revenue might provide additional funding for parks and recreation.
As I discussed in an earlier post, only about 5.6% of Arlington’s is zoned for commercial uses, and that limits the amount of commercial property tax revenue we can generate. Commercial property tax revenue is sometimes referred to as “CIP”, which stands for “Commercial, Industrial, and Personal”. Commercial and Industrial refer to property taxes on land and buildings that are respectively used for commercial and industrial uses. Personal tax is tax on the value of equipment that’s owned and used by a business for the purpose of carrying out whatever their business is. This could include things like desks, display fixtures, cooking equipment, fork lifts, and the like.
In 2020, Arlington’s CIP levy was 5.45%, meaning that 5.45% of our property tax revenue came from Commercial, Industrial, and Property tax revenue. Breaking this down further, 4.2% was commercial ($5,562,528 tax levy), 0.2% was industrial ($278,351 tax levy), and 1.1% was personal ($1,423,117 tax levy). The town’s total 2020 tax levy was $133,350,155. This data comes from MassDOR’s Division of Local Services, and I’ll provide more specific sources in the “References” section of this post.
A CIP levy of 5.45% is low (compared with other communities in the commonwealth), and occassionaly folks like to talk talk about how to raise it. Which is to say, we about how to raise the ratio of commercial to residential taxes. I moved to Arlington in 2007, when our CIP levy was 5.37%. This increased in subsequent years, peaking at 6.26% in 2013, and has been gradually decreasing since. Recall that 2008 was the year the housing market crashed, and the “great recession” began. The value of Arlington’s residential property fell, but the value of business properties was relatively stable in comparison. Thus, our CIP percentage got a boost for a couple of years.
Tax levies (the amount of tax collected) are a direct reflection of the tax basis (the assessed value of property). I’m going to shift from talking about the former to talking about the latter, because that will lead nicely to a discussion about property wealth. Which is to say, the aggregate value of property assessments in town.
Here’s a chart showing Arlington’s net CIP and residential property values, from 1983–2020, adjusted to 2020 dollars. (This is similar to the chart that appears on page 102 of Arlington’s Master plan, but for a longer period of time).
Generally speaking, the value of Arlington’s residential property has appreciated considerably, and there’s a widening gap between our residential and CIP assessments (in terms of raw dollars). Because the gap is so large, it’s helpful to see it on a log scale.
Viewed this way, the curvatures are generally similar, but residential property wealth is rising faster than business property wealth.
In summary, there are three reasons why our CIP is as low as it is: (1) a limited amount of land where one can run a business, (2) the value of residential property is appreciating faster than the value of business property, and (3) occasionally business properties are converted to residential (perhaps with the residential property being worth more than the former business property). That’s not to say we can’t improve the commercial tax base. We can, but we will have to think about what and where, and how to compete with a generally competitive residential market.
References
- MassDOR Division of Local Services reports
- DOR Query Tool for Municipal Property Assessments
- DOR Query Tool for Municipal Tax Levies
- Spreadsheet of Arlington Property Assessments, 1983–2020. Data obtained from MassDOR, with calculations added to adjust for inflation.
- Spreadsheet of Massachusetts Property assessments for 2020. Data obtained from MassDOR.
(Updated 7/2/2020, to add log scale graph and revise conclusion.)
For Arlington’s Nov 2020 Special Town Meeting, my colleague Ben Rudick filed the following warrant article:
ARTICLE 18: ZONING BYLAW AMENDMENT/IMPROVING RESIDENTIAL INCLUSIVENESS, SUSTAINABILITY, AND AFFORDABILITY BY ENDING SINGLE FAMILY ZONING
To see if the Town will vote to amend the Zoning Bylaw for the Town of Arlington by expanding the set of allowed residential uses in the R0 and R1 zoning districts with the goal of expanding and diversifying the housing stock by altering the district definitions for the R0 and R1 zoning districts; or take any action related thereto.
(Inserted at the request of Benjamin Rudick and ten registered voters)
The Inspiration
Our goal with Article 18 is to allow two-family homes, by right, in two districts that are exclusively zoned for single-family homes. This is similar to what city of Minneapolis and the state of Oregon did in 2019. The motivations fall into three broad categories: the history of single-family zoning as a mechanism for racial segregation, environmental concerns arising from car-oriented suburban sprawl, and the regional shortage of housing and its high cost. We’ll elaborate on these concerns in the following paragraphs, and end with a proposed main motion.
Single-family zoning as a mechanism for racial segregation. Single-family zoning began to take hold in the United States during the 1920’s, after the Supreme Court declared racially-based zoning unconstitutional in 1917. Secretary of Commerce Herbert Hoover encouraged cities and towns to adopt single-family zoning ordinances, effectively substituting segregation based on race with segregation based on economic status. The idea was furthered by the Home Owners Loan Corporation of America’s (HOLC’s) redlining maps (created between 1935 and 1940), and the Federal Housing Administration’s (FHA’s) mortgage insurance policies from 1934–1968. The HOLC designated areas with black populations as “hazardous” and actuarially risky, and the FHA used these maps when making underwriting decisions. In short, the FHA was in the business of underwriting loans to white home buyers in white neighborhoods.
Of Arlington’s 7,998 single-family homes, 4,080 (51%) were built during 1934–1968 (per Arlington Assessor’s data). The FHA was the primary mortgage underwriter during this time, and we believe it is reasonable to expect that a substantial number of these homes were originally purchased with FHA mortgages. Put another way, most of our single-family housing was likely built according to FHA guidelines of “avoiding inharmonious mixing or races”, aka segregation. Arlington’s population was 99% white in 1970 and even higher during previous decades. We certainly met the criteria of being a white community.
We believe it’s important to recognize this history, and to have a conversation about how we might restore a balance of fairness.
Environmental concerns. When compared with their multi-family counterparts, single-family homes are less energy efficient, more land intensive, and are associated with higher carbon emissions due to ransportation. Car transportation is a useful analogy; having everyone drive in their own car is more carbon-intensive than carpooling (two-family homes), which in turn is more carbon-intensive than taking the bus (3+ unit buildings). Maps created by Berkeley’s Cool Climate Project show this in a clear way: per household carbon emissions are lower in urban areas than they are in the surrounding suburbs. (Note that authors of the Berkeley report do not advocate getting rid of suburbs, but they do state that suburbs will require different carbon reduction strategies than urban areas).
We believe it is more environmentally responsible to build additional homes on sites that are already developed, rather than (say) going out to the suburban fringes along route 495 and clearing half-acre lots. If we do not provide ample housing within Arlington and other inner-ring suburbs, new workers will likely live further out and have longer, more carbon-intensive commutes. Climate change is a crisis, and our response must involve changing how we live, and that includes ending the twentieth-century pattern of suburban sprawl.
The shortage and high cost of housing. Since 2010, the fifteen cities and towns in the Metro Mayor’s coalition have added 148,000 jobs and 110,000 new residents, but have only permitted 32,500 new homes; this has added to a housing shortage that’s been growing for decades. The imbalance between supply and demand has contributed to rising prices and a very hot market. In 2019, the median sale price for homes in Arlington was $821k. We do not expect construction to be a complete solution to Arlington’s housing costs, but we do believe it is a necessary step in meeting rising demand and counteracting rising costs.
Article 18 is most likely to influence the cost of newly-constructed homes. Newly-constructed single-family homes typically sell in the $1.2M–1.5M range while condominiums in new duplexes typically fall into the $800k–1.1M range. These duplex units are not cheap, but they offer a price point roughly four hundred thousand dollars less than new single-family homes.
We also believe our proposal directly addresses three concerns raised by last year’s multi-family proposal (aka 2019 ATM Article 16):
- Concentration. Last year’s proposal would have concentrated new housing around the town’s business corridors, and Massachusetts Avenue in particular. Article 18 will spread new housing across the majority of the town, as 60% of Arlington’s land area (and 80% of its residentially-zoned land) is currently zoned exclusively for single-family homes (figures provided by Arlingtons Department of Planning and Community Development).
- Height and Shadows. Last year’s proposal would have allowed taller buildings along the commercial corridors; there were concerns about increased height, and the shadows new buildings might cast. Article 18 makes no changes to our zoning bylaw’s dimensional regulation; homes built under this bylaw could be no larger than homes we already allow, by right.
- Displacement. Last year’s proposal drew concerns that businesses and apartment renters would be displaced by new construction. Article 18 applies to districts that are exclusively zoned for single-family homes. 95% of our single-family homes are owner-occupied, and can only be rebuilt or renovated with the owner’s consent. We believe this minimizes any risk of displacement.
Finally, we expect the board will be interested in the number of homes that might be added under this proposal, and the potential impact on the school system. We’ll attempt to address those questions here.
Arlington’s report on Demolitions and Replacement Homes states an average of 27 rebuilds or substantial renovations per year, averaged over a ten year period. For the purpose of discussion, we expect the number of new homes added under this proposed bylaw change to be somewhere between half and double that amount, or 14–54 homes/year. Arlington has 7,998 single-family homes so this is a replacement rate well under 1%/year. It will be nothing like the 500 new homes/year that Arlington was building during the 1920s.
Assessing the impact on the school system amounts (in part) to estimating the number of new school students created by the addition of 14–54 homes/year. One can conceivably see this playing out according to three scenarios. Scenario 1 is simply “by the numbers”. The Housing section of Cambridge’s Alewife District Plan estimates one new student for every 17 new homes (see pg. 145), and the economic analysis of Arlington’s industrial districts gives a net increase of one new student for every 20 new condominiums (see slide 49). Both work out to an increase of 1–3 students per year for the addition of 14–54 homes. This is substantially smaller than past enrollment growth, and something the schools should easily be able to handle.
Second, one could imagine a scenario where elementary school enrollment is in modest decline, as students who entered Arlington public schools in the middle of the last decade move on to middle and high school. Here, new elementary students would utilize existing classroom space, which was created to accommodate students that came before them. It’s a scenario where enrollment stabilizes and doesn’t increase much.
Third, one could picture a scenario where any new home is immediately filled with children. Under this assumption it’s likely that any turnover of single-family homes or suitably-sized condominiums would attract families with children. With 7,998 single-family homes, there is little to prevent another demographic turnover from causing another increase in school enrollment, even if Arlington never adds a single additional home.
In summary, the effects on school enrollment are not easy to predict and several outcomes are possible. Ultimately, this will depend on Arlington’s attractiveness to young families, and our ability to retain these families once their students graduate from school.
Our Proposal to the Arlington Redevelopment Board
We propose that the Zoning Bylaw of the Town of Arlington be amended as
follows:
- By adding the letter “Y” to the “Use Regulations for Residential Districts” table in Section 5.4.3, in the row labeled “Two family dwelling, duplex”, and under the columns labeled “R0” and “R1”;
- By adding the letters “SP” to the “Use Regulations for Residential Districts” table in Section 5.4.3, in the row labeled “Six or more units in two-family dwellings or duplex dwelling on one or more contiguous lots”, and under the columns labeled “R0” and “R1”,
Class of Use | R0 | R1 | R2 |
Two-family dwelling | Y | Y | Y |
Six or more units in two-family dwellings or duplex dwelling on one or more contiguous lots | SP | SP | SP |
and, by making the following changes to the definitions of the R0 and R1 districts in Section 5.4.1(A):
R0: Large Lot Single-FamilyResidential District. The Large Lot Single-FamilyResidential District has the lowest residential density of all districts and is generally served by local streets only. The Town discourages intensive land uses, uses that would detract from the single-family residential character of these neighborhoods, and uses that would otherwise interfere with the intent of this Bylaw.
R1: Single-FamilyR1 Residential District. The predominant uses in R1 are single- and two-family dwellings and public land and buildings. The Town discourages intensive land uses, uses that would detract from the single-family residential character of these neighborhoods, and uses that would otherwise interfere with the intent of this Bylaw.
Related Materials
Our Redevelopment Board Hearing
We presented Article 18 to the redevelopment board on Oct 26th. You can watch the presentation below.
The Redevelopment Board did their deliberations and voting two days later, on October 28th. Their report is available from the Town website.
At least three members of the board were supportive of the effort, but they ultimately voted to recommend this action. I attribute the no action vote to two factors. First, in January 2020 the Redevelopment board agreed to perform a public engagement campaign, to educate residents on housing issues facing the town, and to gather input on how those issues could be addressed. The public engagement effort hasn’t started yet (mainly due to the pandemic), and the board was hesitant to recommend favorable action without doing an outreach campaign first.
Second, the board was interested in attaching standards to single- to two-family conversions, and didn’t feel there was enough time in this town meeting cycle to devise an appropriate set of standards. They were interested in design requirements and collecting payments to an affordable housing trust fund. Standards are interesting idea, and worthy of further consideration. For my own taste, I’d be more inclined to ask for performance standards that tied in to Arlington’s Net Zero Action plan.
So, we are going to take the ARB’s feedback, work on the idea some more, and resubmit during a future town meeting.
As the public hearings on the zoning articles proceeded in late winter and early spring, 2019, it became clear that there was a very strong sentiment that the proposed increase in density in these designated zoning districts should result in an increase in affordable housing in Arlington. This coincided with the approved 2015 Master Plan’s stated goals:
- Encourage mixed-use development that includes affordable housing, primarily in well-established commercial areas.
- Provide a variety of housing options for a range of incomes, ages, family sizes, and needs.
- Preserve the “streetcar suburb” character of Arlington’s residential neighborhoods.
- Encourage sustainable construction and renovation of new and existing structures (see ch. 5, pg 77++ for housing section)
- The Yes on 16 report supports the citizen initiated petition resulting in Article 16 and demonstrates the tremendous impact of rapidly increasing land values on the overall affordability of property in Arlington. Building a stack of homes on one footprint is far more financially affordable than creating a single home on the same footprint of land.
According to a Nov. 26, 2019 Boston GLOBE editorial, there are four tasks necessary to ease the housing crisis in the Greater Boston Region:
- Champion housing production and affordability at the state level.
- Urge private-sector investment in housing solutions.
- Drive inclusive growth.
- Get more involved locally.
This editorial by Paul S. Grogan, president and CEO of the Boston Foundation and Arlington resident, Karen E. Kelleher, executive director of LISC Boston, explain these four tasks. They also describe how much other, comparable urban areas around the US are doing to solve similar housing problems. We are not keeping up with solutions. It will take a collective effort. “Next Level Housing Solutions” is a collaboration of concerned organizations and community leaders intended to move the region toward housing solutions.
Join the Conversation. Click here to join the Next Level Housing Solutions conversation. This just means you will receive information and event updates.
After a week of good coverage on the need for more housing units in the greater Boston region, on August 2, 2019 the GLOBE carried the following editorial, mentioning the situation in Arlington.
Good news? On housing? In Massachusetts?
Yes, that’s right. Even here in the land of the $600,000 starter home, a few forward-thinking cities and towns are starting to make progress on what sometimes seems like an intractable problem: the inadequate production of new housing that has sent the cost of renting or buying in Greater Boston into the stratosphere.
It’s way too soon to declare victory — not when the median sale price for a house in Massachusetts is $429,000 and $420,000 for a condo, according to the Warren Group. High prices happen when demand gallops past supply, causing buyers to bid up prices of existing homes to insane levels. In addition to squeezing renters and contributing to gentrification, the skyrocketing price of housing has evolved into a real threat to the region’s economic competitiveness.
“Greater Boston is losing current and potential domestic residents,” warned the Boston Foundation in its annual housing scorecard, “who are voting with their feet to live elsewhere for a variety of reasons.” Just on Tuesday, another report — this one from the real estate website Apartment List — found that only San Francisco has done a worse job than Greater Boston building new housing to respond to demand.
Thankfully, last year 15 cities and towns in Greater Boston made a joint pledge to pick up the pace of new housing construction by permitting 185,000 new housing units by 2030. Collectively, meeting that goal would mean tripling the pace of housing production. Some of the members of the group, called the Metropolitan Mayors Coalition, are doing their part to reach that goal faster than others — but almost all 15 report progress.
Even outside those three, there’s some impressive municipal-level progress. The Revere City Council approved development on the portion of the former Suffolk Downs racetrack that sits in that city, which will eventually bring in a whopping 2,700 housing units
Leading the way have been Boston, Cambridge, and Somerville, each of which has set numerical goals for housing production. Boston has been on a building spree and is on track to meet its goal of 69,000 new units by 2030. Cambridge volunteered 12,500 new housing units; and Somerville has said it will build 6,000. Committing to a specific goal is crucial: A hard number creates accountability for officials.
In Quincy, 1,500 housing units are under construction, and another 1,030 are either permitted or in the process of receiving permits. Medford has 497 housing units in construction. More than a thousand units are expected in Brookline over the next few years, in part thanks to the state’s 40B housing statute that lets developers bypass local zoning when towns have insufficient levels of affordable housing. Newton has 471 units under construction and another 273 permitted.
Other municipalities are working on plans or reforming zoning bylaws to set the stage for future growth. Austin Faison, Winthrop’s town manager, says that will involve setting a housing production goal. Everett rezoned land near the newly extended Silver Line, setting the stage for development. Braintree is in the process of updating its zoning bylaws that would include provisions for denser multi-family housing.
Arlington experienced a setback when its town meeting rejected an innovative plan to spur denser housing and allow so-called accessory dwelling units. Town manager Adam Chapdelaine said the town was now launching a “more cooperative effort” and would try again, and that the discussion would include coming up with a numerical goal.
The experience in Arlington points to one way the state can help municipalities. Town meetings and city councils require a two-thirds vote to change zoning, which can empower a small minority to thwart reforms needed to encourage housing. Governor Charlie Baker’s housing bill would change that by reducing to one-half the vote needed to change zoning — and deserves legislative approval pronto.
There’s one other way that the state can help, and this one won’t come as a surprise: better transportation. Access to transit can be a key to successful development. For instance, Revere wants a commuter rail stop at Wonderland. Without direct access to any rail service, Everett is banking on buses as part of its development plans.
Cities and towns that are moving forward on housing production inevitably encounter resistance, and they deserve great credit — not just for taking badly needed steps to build housing, but for doing so in a coordinated way. Keeping municipalities on the same page is part of what’s necessary to break down the longstanding barriers to housing in Massachusetts. As Chelsea city manager Thomas G. Ambrosino put it: “Having it be a region-wide effort and everyone rowing toward the same goal makes it easier for us to defend our efforts, because we can tell those who are critical about building that this is a regional need and everyone is in it together.”
No Comments
Leave a comment Cancel