The presentation, dated March 11, 2019, includes slides used to present the information necessary to understand the rationale for zoning changes, the location of the zoning areas under consideration and the charts, tables and maps that help describe the situation. The proposed zoning changes, especially articles 6, 7, 8, 11 and 16, only cover changes affecting about 7% of the Town, those parts of the Town that are currently zoned R4-R7 and the B zoning districts.
Related articles
(This post originally appeared as a one-page handout, distributed at The State of Zoning for Multi-Family Housing in Greater Boston.)
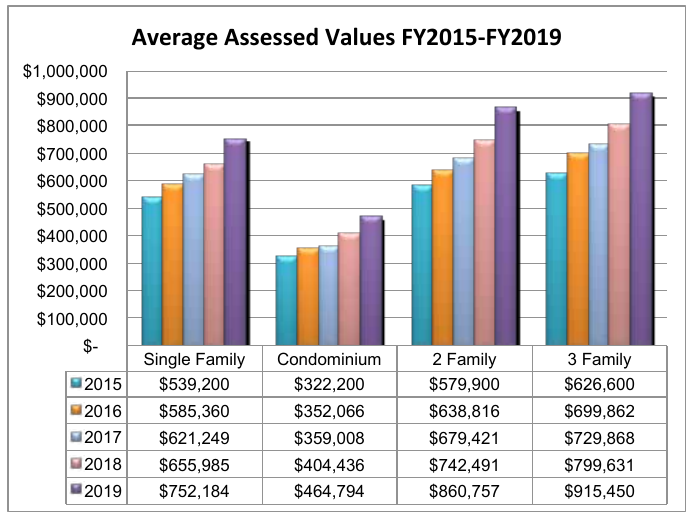
This chart shows the assessed value of Arlington’s low density housing from 2015–2019 (assessed values generally reflect market values from two years prior). During this time, home values increased between 39% (single-family homes) and 48% (two-family homes). Most of the change comes from the increasing cost of land. As a point of comparison, the US experienced 7.7% inflation during the same period. (1)
Arlington has constructed six apartment buildings in the 44 years since the town’s zoning bylaw was rewritten in 1975; we constructed 75 of them in the preceding 44 years.(2) Like numerous communities in the Metro-Boston area, we’re experiencing a high demand for housing, but our zoning regulations have created a paper wall that prevents more housing — including affordable housing — from being built.
Communities need adequate housing, but they also need housing diversity: different types of housing at different price points. The housing needs of young adults are different than the housing needs of parents with children, which are in turn different than the housing needs of senior citizens. As demographics change, housing needs change too. Keeping people in town means providing them with the opportunity to upsize or downsize when the need arises.
If Arlington’s housing costs had only increased with the rate of inflation, the cost of single family housing would average $581K, over $170K less than today. The median household income in Arlington is about $103K/year.(3) Buying an average single family-home with that income on a typical 30-year mortgage would require approximately 46% of a household’s monthly income.(4)
Either homes in Arlington will only be available to people who have much more substantial incomes than current residents, or the town will find a way to balance the rapidly growing cost of land against the housing needs of its current citizens, those still in school, those preparing to downsize as well as those looking for a bigger space.
In addition, Arlington’s commercial economy will thrive with a greater number of housing units so we can keep the empty nesters, and the new college graduates who have lived in the town for years, as well as welcome new Arlingtonians to support our local businesses, restaurants and other services.
Our Town, like others in the state, is looking for ways to balance the needs of our citizens with the market forces of rising land costs while maintaining a healthy, diverse community.
Footnotes
- The inflation amount comes from Inflation amount from https://data.bls.gov/cgi-bin/cpicalc.pl.
- Figures on multi-family unit construction are taken from Arlington Assessor’s data. They reflect multi-family buildings that are still used as rental apartments.
- Income levels come from 2013-2017 ACS 5-year data for Arlington, MA.
- Assuming 10% downpayment, 4% interest, $800/year for insurance, and Arlington’s $11.26 tax rate, the monthly mortgage payment would be nearly $4000/month.
Accessory Dwelling Units (aka “granny flats”)
The following information was presented to the Arlington Redevelopment Board in October, 2020 by Barbara Thornton, TMM, Precinct 16
This Article proposes to allow Accessory Dwelling Units, “as of right”, in each of the 8 residential zoning districts in Arlington.
Why is this zoning legislation important?
Arlington is increasingly losing the diversity it once had. It has become increasingly difficult for residents who have grown up and grown old in the town to remain here. This will only become more difficult as the effects of tax increases to support the new schools, including the high school, roll into the tax bills for lower income residents and senior citizens on a fixed income. For young adults raised in Arlington, the price of a home to buy or to rent is increasingly out of reach.
Who benefits from ADUs?
- Families benefit from greater flexibility as their needs change over time and, in particular providing options for older adults to be able to stay in their homes and for households with disabled persons or young adults who want additional privacy but still be within a family setting.
- Residents seeking an increase in the diversity of housing choices in the Town while respecting the residential character and scale of existing neighborhoods; ADUs provide a non-subsidized form of housing that is generally less costly and more affordable than similar units in multifamily buildings;
- Residents wanting more housing units in Arlington’s total housing stock with minimal adverse effects on Arlington’s neighborhoods.
What authority and established policy is this built on?
Arlington’s Master Plan is the foundational document establishing the validity and mission for pursuing the zoning change that will allow Accessory Dwelling Units.
Under Introduction in Part 5, Housing and Residential Development, the Master Plan states: Arlington’s Master Plan provides a framework for addressing key issues such as affordability, transit-oriented residential development, and aging in place.
The Master Plan states that the American Community Survey (ACS) reports that Arlington’s housing units are slightly larger than those in other inner-suburbs and small cities. In Arlington, the median number of rooms per unit is 5.7. There is a great deal of difference in density and housing size among the different Arlington neighborhoods. The generally larger size of homes makes it easier to contemplate a successful move to encourage ADUs.
What do other municipalities do?
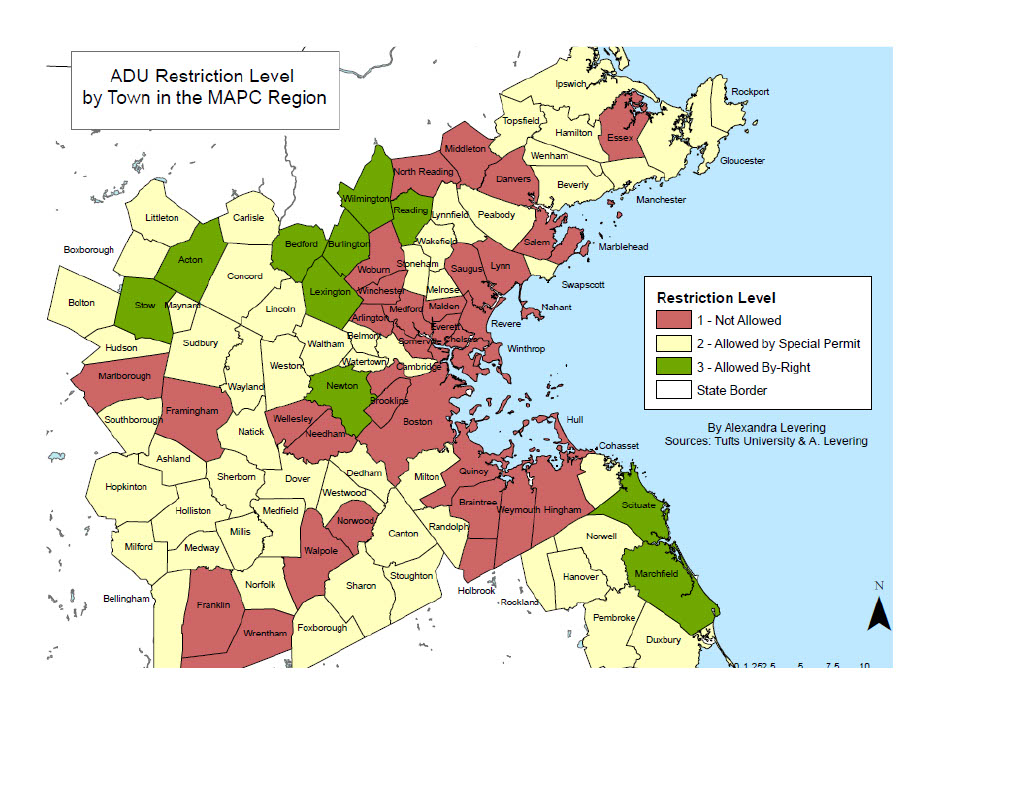
According to a study (https://equitable-arlington.org/2020/02/16/accessory-dwelling-units-policies/), by 2017 65 out of 101 municipalities in the greater Boston (MAPC) region allowed Accessory Dwelling Units by right or by special permit. The average number of ADU’s added per year was only about 3. But by 2017, Lexington had 75 ADUs and Newton had 73. Both of these communities were among about 10 “as of right” municipalities in the MAPC region. This finding suggests that communities with more restrictions are less likely to see any significant affordable housing benefits.
Even in the midst of a housing crisis in this region, according to Amy Dain, housing expert, (https://equitable-arlington.org/2020/02/18/zoning-for-accessory-dwelling-units/) most municipalities still have zoning laws that restrict single family home owners from creating more affordable housing.
And this is despite the fact that, as according to Banker & Tradesman, March 10, 2020: https://www.bankerandtradesman.com/63-percent-in-greater-boston-back-adus/, 63% of people in the region approve of ADUs. California has recently passed strong pro-ADU legislation. A study by Zillow further corroborated this strong interest in communities across the US, including our region. https://equitable-arlington.org/2020/03/10/adu-popularity/.
Learn more about Accessory Dwelling Units/ “Granny Flats” here: https://planning.org/knowledgebase/accessorydwellings/

Massachusetts is experiencing a housing affordability crisis and a climate crisis. For these reasons, Mothers Out Front Arlington supports changes in zoning by-laws that allow greater density in housing near public transit. Mothers Out Front is supportive of the passage of a meaningful MBTA Communities Act that encourages the development of more multi-family housing and a greater diversity of home types in Arlington. A revised zoning by-law to allow for more multi-family housing will reduce pressure to build single family homes on undeveloped land elsewhere in Massachusetts. This safeguards undisturbed ecosystems and provides real alternatives to automotive commutes in the region, reducing both congestion and fossil fuel emissions. In addition, passing this by-law will allow Arlington to participate in the Massachusetts pilot for communities to build fossil fuel-free homes, thus ensuring that new construction in Arlington supports our net-zero climate goals.
Mothers Out Front Arlington respects the public engagement activities that inform the Working Group’s MBTA Communities Act proposal. We appreciate that the Working Group is working with the Town to identify opportunities for developer incentives to encourage public open spaces, mitigate heat islands, and increase the tree canopy. Similarly, the Town’s commitment to maintaining current (and incentivizing higher) zoning requirements for affordable housing also is important to our group. For these reasons, Mothers Out Front Arlington strongly urges the Arlington Redevelopment Board to accept the MBTA Communities Act plan as proposed by the Working Group.