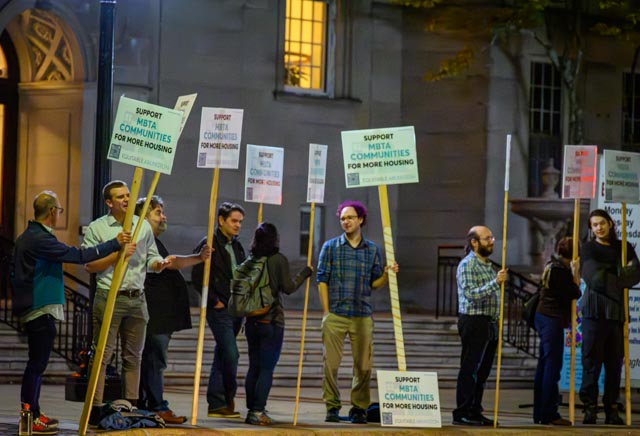
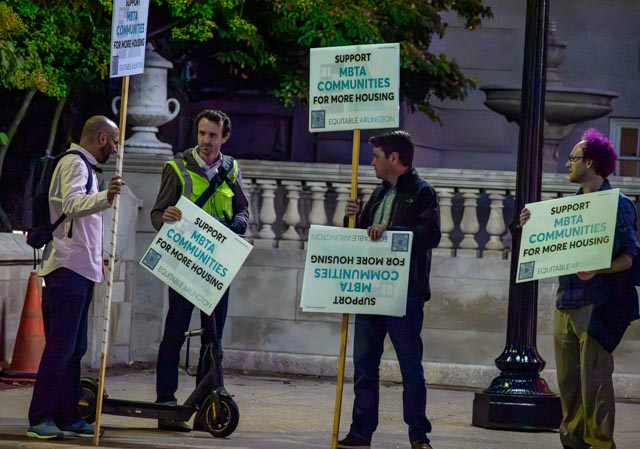
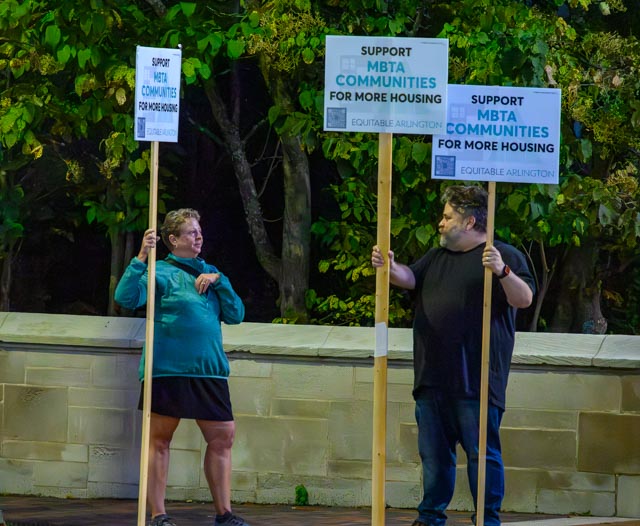
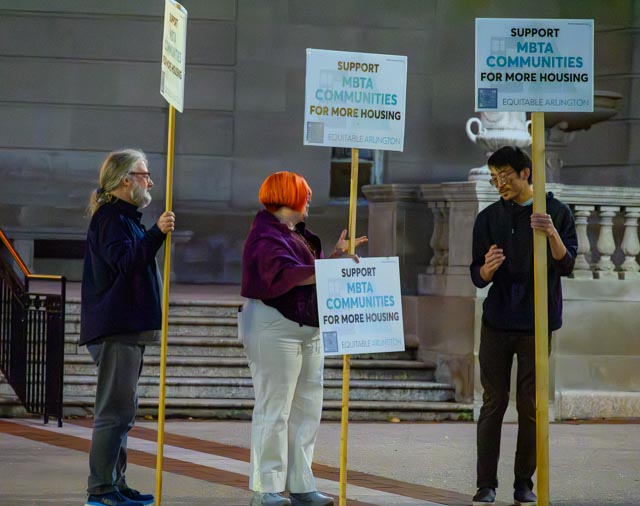
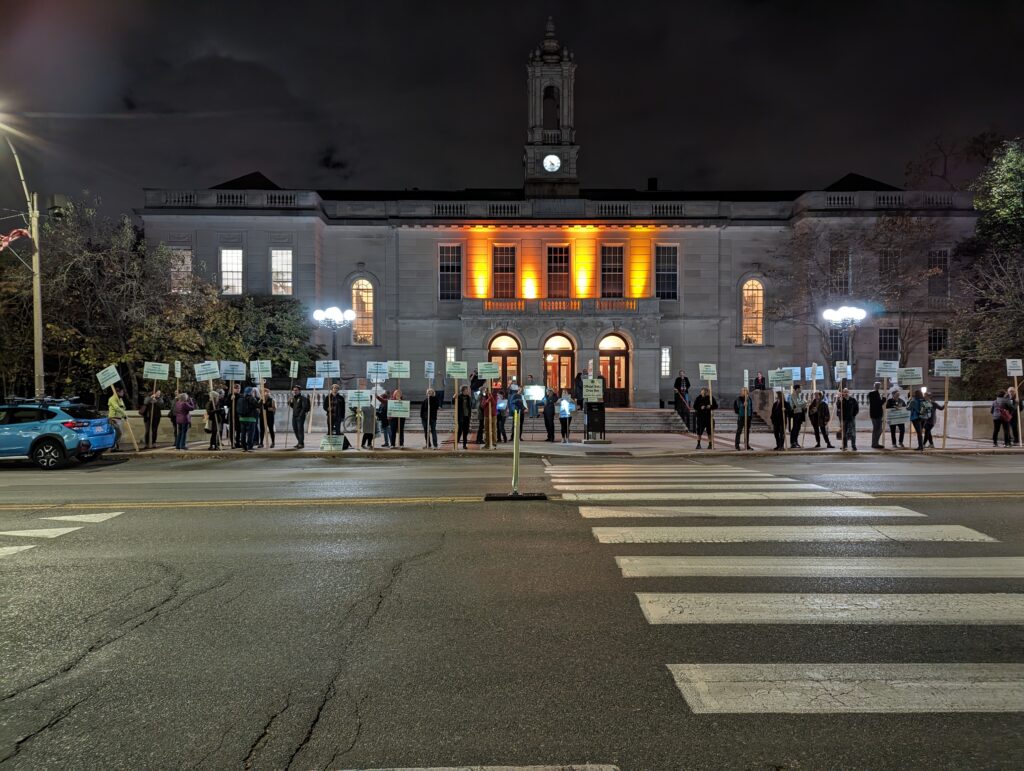
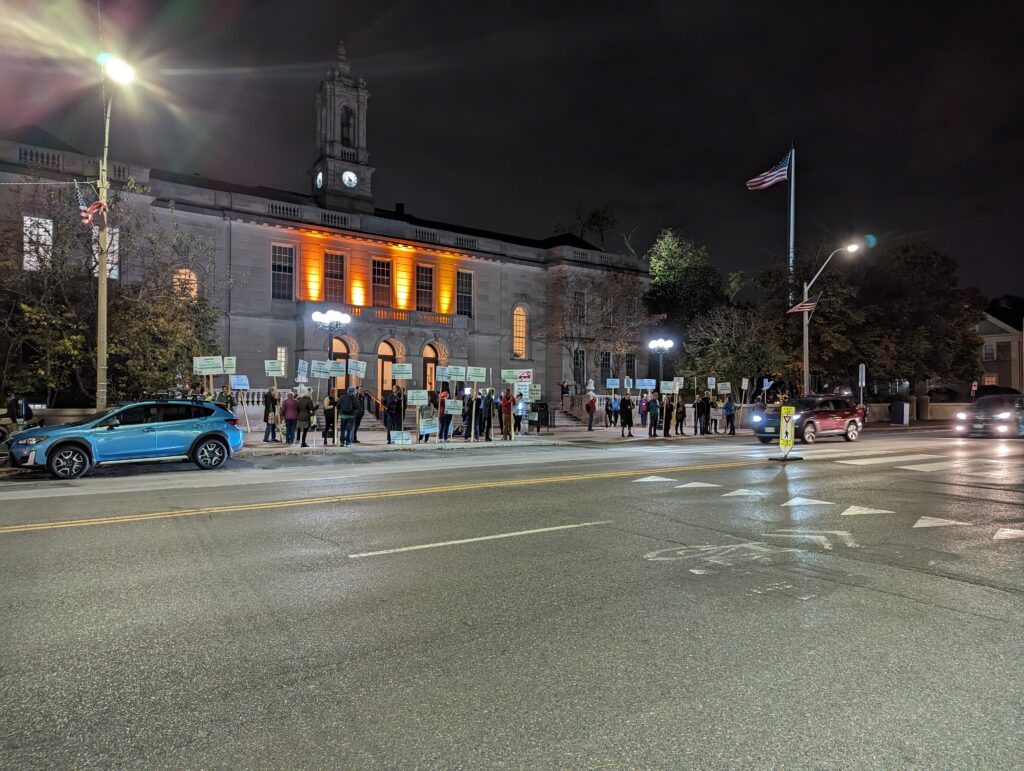
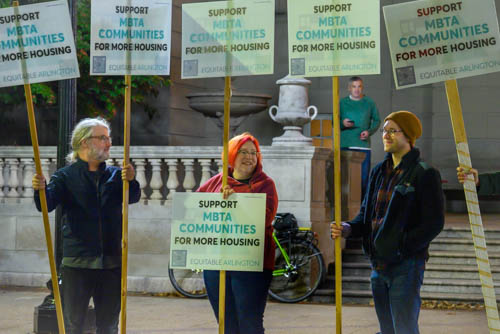
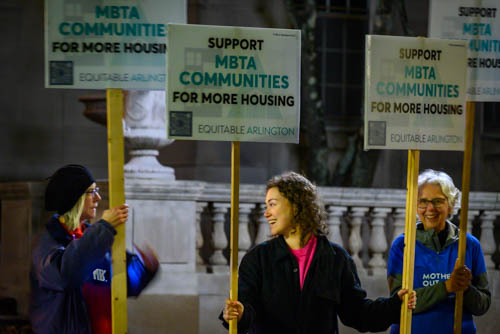
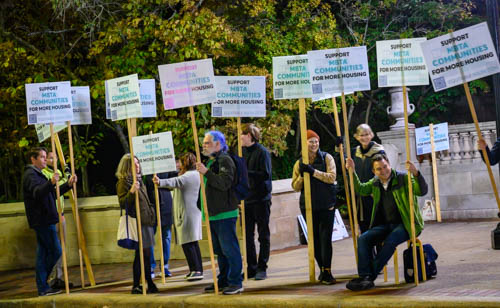
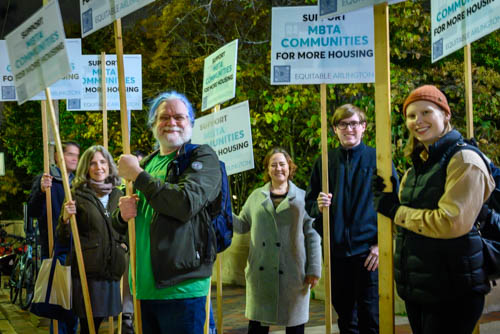
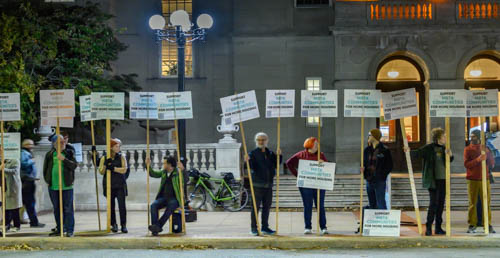
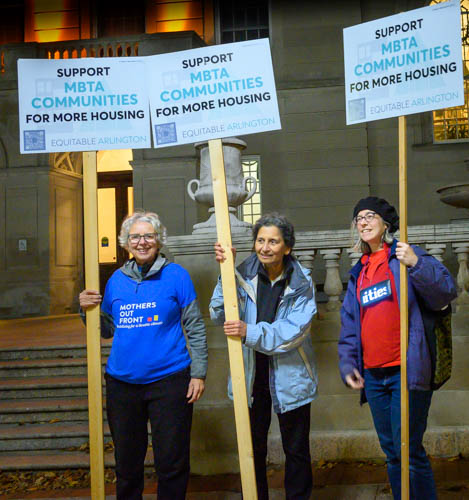
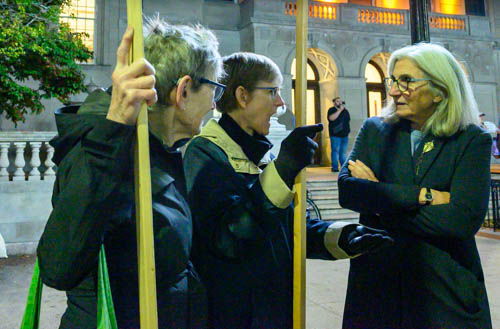
Thanks to so many of you who came out Monday evening for the demonstration in support of the MBTA Communities proposal before the Arlington Redevelopment Board meeting! Over 20 people were there – a substantial and notable showing, especially on such short notice. Paulette Schwarz took some photos of the demonstration early in the evening which she kindly shared with us.
Related articles
by Anson Stewart
Last year, the New York Times published The Climate Impact of Your Neighborhood, Mapped. This interactive feature shows that across the country, carbon emissions per household tend to be lower in relatively dense, walkable, and transit accessible areas. Compared to nearby communities like Winchester, Lexington, and Belmont, the average household in Arlington is responsible for much lower carbon dioxide-equivalent (CO2e) emissions. Allowing more housing along Mass Ave and Broadway, as proposed by the town’s MBTA Communities Working Group, would enable more households to live in these lower-emissions neighborhoods and could be a meaningful step toward reducing driving and Massachusetts’ climate impact.
Zoning Artificially Limits Housing Supply
As noted in the NYT feature above, “For many people today, it is often easier and cheaper to find a home in a high-emissions community than a lower-emissions one… Many cities and local governments often artificially limit the amount of denser or transit-friendly housing available, particularly in wealthier neighborhoods, through zoning that favors single-family homes or requirements around minimum lot sizes and parking spaces.” Zoning restrictions from the 1970s severely constrain housing capacity along the corridors that help reduce climate impacts in Arlington. Those restrictions push families out to places where people drive more to meet their daily needs.
Driving (VMT) is the Largest Source of Massachusetts’ Climate Emissions
Cars are mind-bogglingly detrimental to our climate. According to the Massachusetts Clean Energy and Climate Plan for 2025 and 2030, “Transportation is the largest source of GHG emissions in the Commonwealth, responsible for 42% of statewide GHG emissions as of 2019… Emissions in the transportation sector have stagnated despite state and federal vehicle emissions standards that have gradually increased the fuel efficiency of vehicles. One major cause of increased emissions is the considerable increase in total statewide vehicle miles travelled (VMT) over the past 30 years.” Even as electric vehicles proliferate, the carbon intensity of our grid means driving will have a substantial climate impact, and reducing VMT must be a primary strategy.
The NYT analysis uses nationally available survey and expenditure data, so income and other effects may confound the estimates of transportation emissions. Massachusetts has a unique dataset that allows measuring driving emissions much more directly – the Massachusetts Vehicle Census (mentioned in the town Working Group report).
For each municipality, dividing the daily mileage driven (of cars registered there) by the population yields vehicle miles traveled (VMT) per capita, which varies widely in the Boston region. For example:
- Cambridge: 8 miles per person per day
- Somerville: 11
- Arlington: 14
- Boston: 14
- Belmont: 14
- Medford: 15
- Lexington: 16
- Winchester: 17
- Waltham: 17
- Woburn: 24
Thanks to Arlington’s walkable neighborhoods and transit access, our per capita VMT is lower than many nearby communities, and even on par with the City of Boston!
If Not Arlington, Then Where?
As a thought experiment, consider a climate-conscious family of four who wants to buy a condo in one of the communities above. If they can’t afford Cambridge, Somerville, or Arlington (where 2023 YTD median condo sale prices were $910k, $855k, and $810k respectively), they might consider Waltham or Woburn ($615k and $638k, respectively), or even Winchester or Lexington ($795k and $798k).
Lexington in particular might be appealing, especially as their Town Meeting recently adopted MBTA Communities zoning that allows much more multifamily housing than the minimum required (see the Lexington Cluster Housing Study Group materials in support of meaningful new housing supply). But even with that new capacity, the pace of development will be slow and most of the transportation “bones” of Lexington will be fixed. It is generally less transit accessible than Arlington, and all else equal, the family would likely end up driving more than if they lived in Arlington.
Assuming the average VMT per capita figures above, a family of four would end up driving an additional 2,920 miles per year living in Lexington versus Arlington. Assuming 30 mpg fuel efficiency and 8.9 kg CO2e per gallon of gas, the incremental emissions from this one family would be 865 kg of CO2e, equivalent to the annual carbon sequestered by six half-century-old red oak trees (according to Forest Service data here).
If this family moved to Woburn instead of Arlington, the incremental annual driving would be 14,600 miles. Associated emissions would be over 4.3 metric tons, equivalent to the annual carbon sequestered by 32 of those red oak trees.
Extrapolating These Emissions
How does this example of one family relate to the level of development Arlington might see from MBTA Communities zoning updates? The Working Group’s proposal had a nominal capacity of just over 7,000 housing units in an area that currently has about 2,100. The ARB recommendation to Town Meeting cuts the nominal capacity to around 3,400, for a possible net change of around 1,300 units theoretically allowed. Recent estimates (following the approach here) suggest that this capacity might result in 100 to 300 new housing units built in Arlington by 2033.
If new units enable 250 families like the one above to live in Arlington instead of Woburn, these back-of-the-envelope calculations suggest the avoided annual emissions from VMT reduction would be over 1,000 metric tons CO2e in the year 2033.
Of course these are rough estimates, and the actual climate impact will depend on wider development trends, grid decarbonization, MBTA service, and the details of the zoning that Town Meeting adopts later this month. Low parking requirements (as originally proposed by the Working Group) and robust transportation demand management could help strengthen the climate change mitigation potential of Arlington’s MBTA Communities zoning update. On the other hand, further reductions in Arlington’s multifamily housing capacity would exacerbate emissions. Those concerned about reducing our collective climate impact should take note.
This timely report on the question of affordable housing vs. density comes from the California Dept. of Housing & Community Development and mirrors the situation in the region surrounding Arlington MA.
Housing production has not kept up with job and household growth. The location and type of new housing does not meet the needs of many new house- holds. As a result, only one in five households can afford a typical home, overcrowding doubled in the 1990’s, and too many households pay more than they can afford for their housing.
Myth #1
High-density housing is affordable housing; affordable
housing is high-density housing.
Fact #1
Not all high density housing is affordable to low-income families.
Myth #2
High-density and affordable housing will cause too much traffic.
Fact #2
People who live in affordable housing own fewer cars and
drive less.
Myth #3
High-density development strains public services and
infrastructure.
Fact #3
Compact development offers greater efficiency in use of
public services and infrastructure.
Myth #4
People who live in high-density and affordable housing
won’t fit into my neighborhood.
Fact #4
People who need affordable housing already live and work
in your community.
Myth #5
Affordable housing reduces property values.
Fact #5
No study in California has ever shown that affordable
housing developments reduce property values.
Myth #6
Residents of affordable housing move too often to be stable
community members.
Fact #6
When rents are guaranteed to remain stable, tenants
move less often.
Myth #7
High-density and affordable housing undermine community
character.
Fact #7
New affordable and high-density housing can always be
designed to fit into existing communities.
Myth #8
High-density and affordable housing increase crime.
Fact #8
The design and use of public spaces has a far more
significant affect on crime than density or income levels.
See an example of a “case study” of two affordable housing developments in Irvine CA, San Marcos at 64 units per acre.
San Paulo at 25 units per acre.
Both are designed to blend with nearby homes.
Text of Warrant Article 8: (To be considered at Special Town Meeting (Virtual), Mon. 11/16/20 at 8:00 p.m.)
“ARTICLE 8 ACCEPTANCE OF LEGISLATION/BYLAW AMENDMENT/ MUNICIPAL AFFORDABLE HOUSING TRUST FUND
To see if the Town will vote to accept Massachusetts General Laws c. 44 § 55C, to authorize the creation of a Municipal Affordable Housing Trust Fund to support the development of affordable housing in Arlington, establish a new bylaw for the administration of same; or take any action related thereto. (Inserted by the Select Board)”
What will it do? How will it work?
A Proactive Step to Address Housing Affordability. With a municipal affordable housing trust, Arlington will join more than 113 Massachusetts municipalities that have formed a housing trust fund to support a proactive strategy for building housing affordability. The Trust is a small step the Town can take to more proactively address the housing affordability crisis that challenges many of our current residents and makes Arlington increasingly inaccessible to new residents. Creating affordable housing can also be a strategy for maintaining or increasing diversity.
Ability to Act Quickly.
A primary benefit of a housing trust is to enable the Town to act quickly to support or participate in transactions that increase or preserve affordable housing in Arlington. Without a Trust, the Town does not have the flexibility or agility to act quickly. Following are some examples, though there are many other ways that trusts can and do advance housing affordability:
• Financing the acquisition and/or development of market properties for conversion to affordable housing by a nonprofit developer;
• Purchasing an existing affordable home to ensure resale to another low income buyer, or purchasing a market rate home to create an affordable homeownership opportunity;
• Providing flexible financing to increase the number of affordable units or reduce income levels in existing or new projects that include affordable housing.
Developing a Housing Trust Strategy Over Time.
The strategies to be pursued by the Trust would be set forth by the Trustees in a plan or proposal(s) they would lay out after they are appointed, most likely after/through a process of public engagement. The specific strategies are, deliberately, not part of the warrant article or the Bylaw proposed for adoption. This allows the Town the flexibility to set and modify the Town’s housing strategies over time, in a manner that is responsive to the public and its elected representatives. The Bylaw requires the strategy or plan, and most major Trust decisions, to be approved by the Select Board, and Town investments in the Trust would still require Town Meeting approval.
Funding the Affordable Housing Trust Fund.
Creating affordable housing requires substantial subsidy. The Trust’s ability to cause more affordable housing to be created or preserved in Arlington will be directly related to the availability of resources to fund it and leverage additional state and federal resources. The vote before the Special Town Meeting this fall will not provide any funding for the Trust.
While it is anticipated that the Trust might receive initial funding via a grant of Community Preservation Act funds from the CPA Committee, to increase our impact, more resources will be needed.
How Other Communities Fund Their Housing Trust Funds.
The Community Preservation Act is the most common source of funding, but the most impactful trusts tend to have a variety of funding sources that result in a steady flow of financial resources into the Trust. Other municipalities have tapped into a variety of additional sources, including inclusionary zoning payments, federal HOME funds, voluntary/negotiated developer payments, proceeds from sale of tax foreclosed or other Town-owned properties, cell tower payments, cannabis-related revenue, short-term rental fees, fees for managing housing lotteries, sale of bonds, general municipal funding, and private donations. Many also donate excess town property to their housing trust for sale and redevelopment as affordable or mixed income housing. More recently, a number of cities and towns have proposed home rule petitions that would allow them to impose a small fee on the transfer of real property to fund their housing trusts, and there is state legislation proposed to authorize cities and towns to impose such transfer fees without sending a Home Rule Petition to the state legislature.
Building Trust Resources Through a Transfer Fee.
The Housing Plan Implementation Committee originally recommended that Town Meeting adopt a bylaw creating a housing trust and create a funding source for it by voting to authorize the filing of a home rule petition to impose a modest real estate transfer fee. Although the Select Board elected to defer consideration of the transfer fee until 2021, such a fee is attractive to many, because it would be borne only by those selling their Arlington homes or properties, and because it provides a mechanism to capture a very small portion of the extraordinary equity increase that Arlington property owners have realized over many years due to regional market forces. The details of such a fee are important and merit further discussion, but it presents a promising potential revenue source to empower the Trust to be proactive.
The Process.
The article in front of the Special Town Meeting would start the process of creating a municipal affordable housing trust. Once approved by Town Meeting the Affordable Housing Trust Bylaw would be submitted to the Attorney General to certify its consistency with the state law governing housing trusts within 90 days. Once so certified, the Town Manager will appoint trustees, including at least one member of the Select Board. Once these appointments are confirmed by the Select Board, the Trustees themselves would lead the process of proposing an initial set of goals and strategies for the Trust to implement, after approval by the Select Board.
Financial Stability & Accountability.
The Trust will be governed by the MAHT law passed in 2005 that specifies powers and limitations for trusts of this type. The proposed Bylaw has been reviewed and modified pursuant to suggestions of the Finance Committee to ensure accountability and financial stability. The Trust will be managed by the Treasurer, will be audited annually, will have legal and practical limitations on its borrowing capacity, and will not have the power to pledge the full faith and credit of the Town.
To learn more about municipal affordable housing trusts, refer to the MHP Municipal Affordable Housing Trust Fund Guide, v.3
******
This information was prepared by Karen Kelleher, Arlington Town Meeting Member, Precinct 5, Member, Arlington Housing Planning Implementation Committee and Executive Director, LISC Boston ( Local Initiative Support Corporation)
This is the second in a series of “Arlington 2020” articles. The first article looked at the number of one-, two-, and three-family homes and condominiums in Arlington, and how that housing stock has changed over time. This article will examine changes in the value of those properties. We’re going to look at “value” through the lens of property assessments, so we should start with an explanation of what property assessments are and how they’re used.
A property assessment is simply the Town Assessor’s best estimate of what a property is worth, based on market values. The assessor’s office inspects properties every ten years; during intervening years, assessments are adjusted based on sale prices of similar homes in a given tax neighborhood. For all practical purposes, assessed values tend to trail market values by two years. In my neighborhood, property assessments are spot on — my house was assessed at $501,000 in 2020; during 2018, sales of similar homes in the neighborhood ranged from $495,000 to $520,000.
Condominiums have a single assessed value, which includes land and buildings. Otherwise, assessed values are broken down into land value, building value, and yard items (e.g., a garage or a shed).
Assessed values are used to determine the tax rate. The assessors page on the town website has calculations in worksheet form, but for all practical purposes, it’s just a division problem. One takes the total tax levy and divides by the sum of all property assessments (in thousands of dollars), and that’s the tax rate. An individual’s taxes are the assessed value of their property (in thousands of dollars) multiplied by the tax rate. If an individual owns (say) 1% of the assessed value in town, that individual will pay 1% of the property tax levy.
The main point is that assessed values are based on market values, but with a two-year lag. Consequently, we can use them as a way to see how home prices have changed over time.
With that background information out of the way, we can look at some numbers. Here’s a graph of the median assessed values for condominiums, one-family, two-family, and three-family homes from 2013 through 2020. (the “median” is a value such that half of the assessments are above, and half are below).
year | Condominium | Single Family | Two-family | Three-family |
2013 | $297,800 | $472,850 | $532,650 | $581,600 |
2014 | $300,150 | $484,400 | $530,000 | $574,800 |
2015 | $318,200 | $507,900 | $572,000 | $616,300 |
2016 | $351,050 | $546,300 | $623,150 | $673,550 |
2017 | $357,750 | $581,200 | $663,900 | $714,800 |
2018 | $395,400 | $618,800 | $732,100 | $787,600 |
2019 | $463,250 | $701,550 | $851,200 | $897,500 |
2020 | $473,100 | $771,900 | $944,000 | $1,010,850 |
%change | 58.87% | 63.24% | 77.23% | 73.81% |
As one would expect, two-family homes are worth more than single-family, and three-family are worth more than two. Condominiums have a lot of variety; they could be half of a duplex, or a single unit in an apartment building. But a general upward trend is clearly evident.
These values are straight out of the assessor’s database, and not adjusted for inflation. The Bureau of Labor Statistic’s inflation calculator shows 12% inflation between 2013 and 2020; the %change is pretty considerable, even if one deducts 12% for inflation.
Next, I’d like to dig further into the 1–3 family assessments, by breaking them down into the value of land vs the value of buildings, and showing how that’s changed over time.
Single-family homes:
year | Land value | Building value | Total assessed value |
2013 | $243,700 | $226,300 | $472,850 |
2014 | $253,750 | $227,050 | $484,450 |
2015 | $272,700 | $229,900 | $507,900 |
2016 | $296,400 | $243,950 | $546,400 |
2017 | $326,400 | $246,400 | $581,250 |
2018 | $360,900 | $248,100 | $618,800 |
2019 | $440,400 | $250,400 | $701,600 |
2020 | $448,600 | $316,300 | $771,900 |
%change | 84.08% | 39.77% | 63.24% |
Two-family homes:
year | Land value | Building value | Total assessed value |
2013 | $202,500 | $320,550 | $532,650 |
2014 | $212,250 | $307,800 | $530,000 |
2015 | $256,400 | $309,800 | $572,000 |
2016 | $262,500 | $349,400 | $623,150 |
2017 | $307,000 | $350,700 | $663,900 |
2018 | $352,500 | $373,900 | $732,100 |
2019 | $478,300 | $374,850 | $851,700 |
2020 | $454,500 | $486,100 | $944,000 |
%change | 124.44% | 51.65% | 77.23% |
Three-family homes:
year | Land value | Building value | Total assessed value |
2013 | $200,100 | $377,900 | $581,600 |
2014 | $209,100 | $364,100 | $574,800 |
2015 | $249,800 | $366,550 | $616,300 |
2016 | $259,950 | $412,350 | $673,550 |
2017 | $298,100 | $412,500 | $714,800 |
2018 | $343,050 | $438,800 | $787,600 |
2019 | $459,000 | $440,100 | $897,500 |
2020 | $440,100 | $578,450 | $1,010,850 |
%change | 119.94% | 53.07% | 73.81% |
There are several things worth pointing out in these breakdowns.
First, note that the land and building values “jump” a bit between 2019–2020. 2020 was one of our full reassessment years, so I’m willing to attribute this to a periodic course correction. The total increase is generally linear, but the land/building composition has changed.
Second, the median land value for single-family homes is higher than the median building value, for all years between 2013–2020.
Third, most of the increases come from changes in land value. I believe this comes down to location, location, and location. Arlington has a well-respected public school system, and it’s close to universities and tech centers is Cambridge and Boston, and office parks in Lexington, Waltham, and Burlington. City amenities are close at hand.
So what does one do about our rising home prices, and in particular, the rising value of land? The first (and perhaps default) answer is to do nothing. Rising property values are a boon to homeowners who purchased a capital asset (i.e., a house) in the past, and have seen its value appreciate over time. The downside of doing nothing is that each year, increasing housing prices create an ever-increasing income threshold for new residents.
An alternative approach would be to allow more (and smaller) units to be built on each lot. This requires reconstruction or redevelopment, but it allows the cost of land to be amortized among several households. More units/lot means more people and more density, but it reduces the income threshold for buying in to Arlington. (Note that the per-unit cost for three-family homes is lower than the per-unit cost for two-family homes. Similarly, the per-unit cost for two-family homes is lower than the cost of a single-family home).
A third article will look at the distribution of housing prices in Arlington, and how the distribution varies by housing type.
Here is a spreadsheet of data shown in this post.
Why Is This Our Issue & What Should We Do About It?
(presented by Adam Chapdelaine, Town Manager, to Select Board on July 22, 2019)
Overview
Since 1980 the price of housing in Massachusetts has surged well ahead of other fast growing states including California and New York. While the national “House Price Index” is just below 400, four times what an average house might have cost in 1980, a typical house in Massachusetts is now about 720% what it was in 1980. Median household income in the state has only increased about 15% during the same period. No wonder people in Arlington are feeling the stresses of housing costs if they want to live here and are feeling protective of the equity value time has provided them if they bought years ago.
In response to concerns about zoning, affordable housing and housing density, the Town joined the “Mayors’ (and Managers’) Coalition on Housing” to address these growing pressures. This 12 page slide deck presentation outlines the key data points, the number of low and very low income households in Arlington, the rate of condo conversion that is absorbing rental units, etc.
Solutions are offered including:
• Amendments to Inclusionary Zoning Bylaw
• Housing Creation Along Commercial Corridor – Mixed Use & Zoning Along Corridor
• Accessory Dwelling Units – Potential Age & Family Restrictions
• Other Tools Can Be Considered That Are Outside of Zoning But Have An Impact on Housing
Chapdelaine’s suggested next steps are:
• Continued Public Engagement
• Town Manager & Director of DPCD Meet with ARB
• Select Board & ARB Hold Joint Meeting in Early Fall
• ARB Recommends Strategies to Pursue in Late Fall/Early Winter
The Select Board approved the suggested next steps and a joint ARB/ Select Board meeting should be scheduled in the near future.
Note from Reporter: As a community, Arlington has long prided itself on its economic diversity. With condo conversions, tear downs leading to “McMansions”, higher paid workers arriving in response to new jobs, etc., Arlington is at great risk of losing this diversity that has long enriched the community. Retirees looking to downsize and young people who have grown up in Arlington looking for their first apartment are finding it impossible to stay in town. Shop keepers and town employees are challenged to afford the rising housing costs. With a reconsideration of zoning along Arlington’s transit corridors, Arlington NOW has an opportunity to create new village centers, like those recommended in the recent STATE OF HOUSING report. These village centers along our transit corridors could be higher, denser but also offer the compelling visual design and amenities desired by people who want to walk to cafes, shops and public transit.
State Senator Cindy F. Friedman has written a letter to Town Meeting Members supporting Warrant Article 12 and a meaningful MBTA Communities Plan. She writes:
We all want Arlington and Massachusetts to remain welcoming, accessible places to live. In addition to our deficit of housing, I recognize the importance of encouraging smaller, more sustainable housing in walkable areas. Arlington’s Warrant Article 12 will provide a meaningful framework for making progress in these areas. The problems we are experiencing now —out of reach housing prices for new construction and existing homes — exacerbate the crisis and are seriously threatening the economic vibrancy of our communities.
To read Friedman’s full letter, click here for the PDF.
In a 2019 study, MAPC found that:
- Three out of ten spaces sit empty during peak demand
- The key factors that drive parking demand are parking supply, transit accessibility and the percentage of deed-restricted units
This study raises important questions about the wisdom of continuing to commit large sections of the land area of our municipalities to be on reserve for parking cars. Such extra space could be used to benefit the open space, environmental sustainability and the need for more housing.
Jennifer Susse authored this letter on January 20, 2020. Ms. Susse is a member of the Arlington School Committee and a Town Meeting Member. She closely follows the costs and demographic trends of school enrollment and of Town finances.
I write in support of efforts to increase housing in Arlington, both as a resident and as a member of the School Committee. I support these efforts not in spite of their potential effects on our schools, but because of their potential effects on both schools and town.
I have often spoken to the community about our rapid enrollment growth — over 2,000 students added in the last 25 years, 60 percent of those in the last 10 years. Because of these large enrollment increases the Arlington Public Schools have had to add capacity, which the town has generously supported. So how can I be in favor of adding more housing to Arlington, and thus potentially adding even more students to our already stressed school facilities?
Losing diversity
I will get to the capacity issue in a bit, but first I want to point out that in the last 30 years Arlington has lost both economic and generational diversity. The story about the loss of economic diversity is well known; the loss of generational diversity less so.
Between 1990 and 2010, the percentage of residents between 20 and 34 dropped from 28 percent to 17 percent. During that same period, the population over 65 dropped from 18 percent to 16 percent. What replaced these demographic groups were primarily residents between the ages of 35 and 54 and 0 and 14. In other words, mostly families with school-aged children. The loss of both types of diversity weakens the fabric of our community. However, the loss of generational diversity also weakens the town’s finances.
The average cost to the town of an additional student is about $8,500, a number that includes what’s known as the Enrollment Growth Factor (the amount that the town gives to the schools for each additional student in the system, currently at 50 percent of the per pupil cost of the preceding year, or $7,297), as well as the average cost of the benefits that the town pays for new hires.
What this means is that during the time a household has children in the school system, it is likely receiving more in benefits than it pays in taxes. For the town’s finances to work, we also need people who do not have children to live and pay taxes in Arlington, including young adults and older adults for whom Arlington is becoming less affordable because of condo conversions, teardowns, etc.
Overcrowded classrooms
But what about our overcrowded classrooms? The answer is that given the type of housing likely to be created on the main corridors, and the timing of that housing construction, I am not worried about further stresses to our school facilities.
By the time new housing is built, our elementary-aged population will likely be in modest decline. Five to 10 years out we expect to see enrollment stabilize at the middle and high school levels as well. That does not mean that we will have tons of extra space; just that we will no longer be in danger of taking over art, music, and literacy rooms for general classroom use.
Enrollment projections made by Dr. Jerome McKibbin in 2015 have so far been fairly accurate. His revised projections show that, without additional housing, we are expected to have 350 fewer elementary-aged students in the Arlington Public Schools 12 years from now than we have today.
The discussion about housing in Arlington reminds me of the discussion a few years ago over the Affordable Care Act. At that time, there was a lot of anxiety about potential changes to the health-care system, but insufficient appreciation (in my opinion) of the then current trends.
Zoning changes
Any discussion of zoning changes in Arlington must take an honest look at where we are now, and the direction we are headed in if there were no zoning changes. Our current trends have us losing natural affordability and economic and demographic diversity because of teardowns, condo conversions and sharp price increases. We don’t have the option to freeze Arlington as we know it today (or 10 years ago) in place.
In closing, I would like to say that I am proud of our excellent schools and strongly believe that families who have recently moved to Arlington have strengthened our community, but I do not want Arlington to become a place where people move in with toddlers and move out soon as their children graduate from high school. The current trends have us losing both economic and generational diversity, which threatens not only our community and civic life, but our financial health as well. Adding more and diverse housing can help.