In 2015 Town Meeting approved the Master Plan. Following is the Housing chapter of that plan. It contains a great deal of information about details of the housing situation in Arlington, challenges of housing price increases, needs for specialty housing, opportunities for meeting these needs, etc. The authors found that “most cities and towns around Arlington experienced a significant rise in housing values from 2000 to 2010. A 40 percent increase in the median value was fairly common. However, Arlington experienced more dramatic growth in housing values than any community in the immediate area, except Somerville. In fact, Arlington’s home values almost doubled.” This and related data helps explain why the need for affordable housing is now so acute.
Related articles
Why Is This Our Issue & What Should We Do About It?
(presented by Adam Chapdelaine, Town Manager, to Select Board on July 22, 2019)
Overview
Since 1980 the price of housing in Massachusetts has surged well ahead of other fast growing states including California and New York. While the national “House Price Index” is just below 400, four times what an average house might have cost in 1980, a typical house in Massachusetts is now about 720% what it was in 1980. Median household income in the state has only increased about 15% during the same period. No wonder people in Arlington are feeling the stresses of housing costs if they want to live here and are feeling protective of the equity value time has provided them if they bought years ago.
In response to concerns about zoning, affordable housing and housing density, the Town joined the “Mayors’ (and Managers’) Coalition on Housing” to address these growing pressures. This 12 page slide deck presentation outlines the key data points, the number of low and very low income households in Arlington, the rate of condo conversion that is absorbing rental units, etc.
Solutions are offered including:
• Amendments to Inclusionary Zoning Bylaw
• Housing Creation Along Commercial Corridor – Mixed Use & Zoning Along Corridor
• Accessory Dwelling Units – Potential Age & Family Restrictions
• Other Tools Can Be Considered That Are Outside of Zoning But Have An Impact on Housing
Chapdelaine’s suggested next steps are:
• Continued Public Engagement
• Town Manager & Director of DPCD Meet with ARB
• Select Board & ARB Hold Joint Meeting in Early Fall
• ARB Recommends Strategies to Pursue in Late Fall/Early Winter
The Select Board approved the suggested next steps and a joint ARB/ Select Board meeting should be scheduled in the near future.
Note from Reporter: As a community, Arlington has long prided itself on its economic diversity. With condo conversions, tear downs leading to “McMansions”, higher paid workers arriving in response to new jobs, etc., Arlington is at great risk of losing this diversity that has long enriched the community. Retirees looking to downsize and young people who have grown up in Arlington looking for their first apartment are finding it impossible to stay in town. Shop keepers and town employees are challenged to afford the rising housing costs. With a reconsideration of zoning along Arlington’s transit corridors, Arlington NOW has an opportunity to create new village centers, like those recommended in the recent STATE OF HOUSING report. These village centers along our transit corridors could be higher, denser but also offer the compelling visual design and amenities desired by people who want to walk to cafes, shops and public transit.
(By Vince Baudoin and James Fleming)
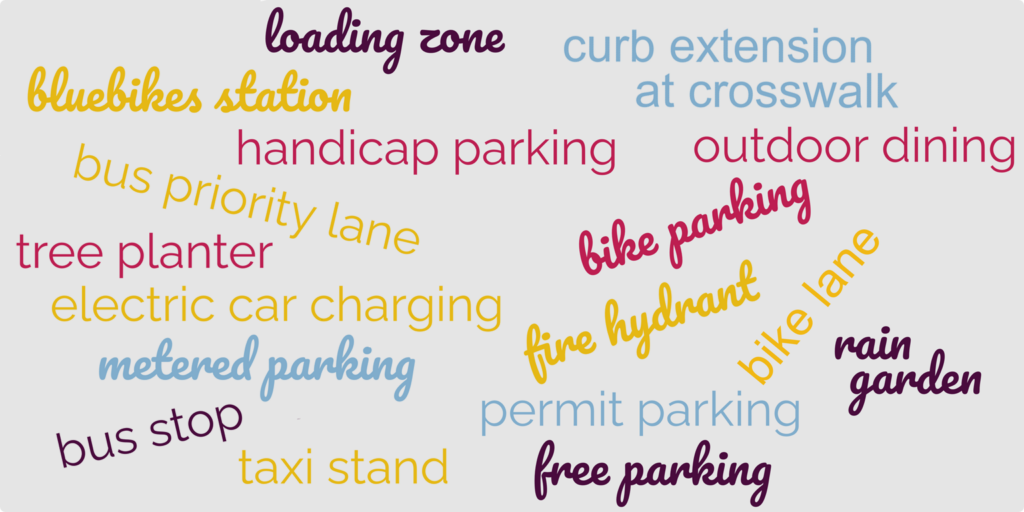
Could Arlington be better using its curb space? Here are some ways the curb can be used to create green infrastructure, promote public safety and accessibility, support sustainable transportation, strengthen business districts, and enable new ‘car-light’ development.
Roughly six inches high and made of concrete or granite, the curb marks the edge of the roadway, channels runoff, protects the sidewalk, and gathers stray leaves. When not assigned any other use, the space in front of the curb it usually serves as free storage for personal automobiles.
Yet the humble curb is a limited resource that can serve the community in many more ways. Have you thought about how your town budgets its curb space? For that matter, has your town thought about how it budgets its curb space?
While Arlington mostly uses its curb space for parking, some areas have other curb uses designed to achieve a specific goal. Consider the streets you use often. Have you seen an unsolved problem, or a missed opportunity, that a different use of the curb could help solve?
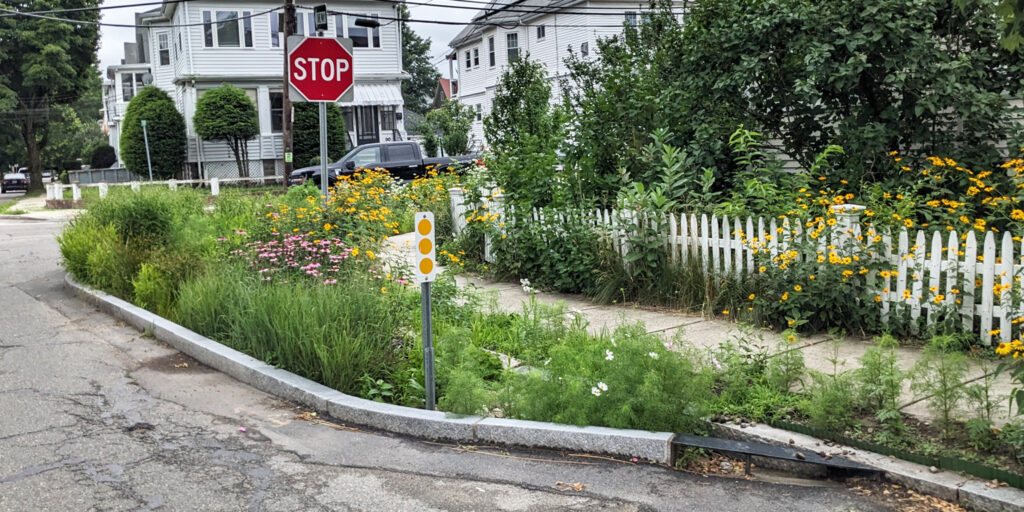
Create green infrastructure
The Town has miles of paved roadway. When it rains or snows, water runs into storm drains, carrying salt, oil, and other pollutants with it. The storm drains dump these pollutants directly into long-degraded waterways such as the Mill Brook, Alewife Brook, and the Mystic River. The Public Works department struggles to keep grates clear and drains from overflowing.
One solution: Use the curb for more greenery! The curb can be extended to create a rain garden or tree planting strip. The rain garden helps slow runoff and filter the water before it enters the drain, while trees benefit from additional room for the roots to grow without damaging the sidewalk. A side benefit: narrowing the street encourages drivers to slow down, making neighborhoods safer.
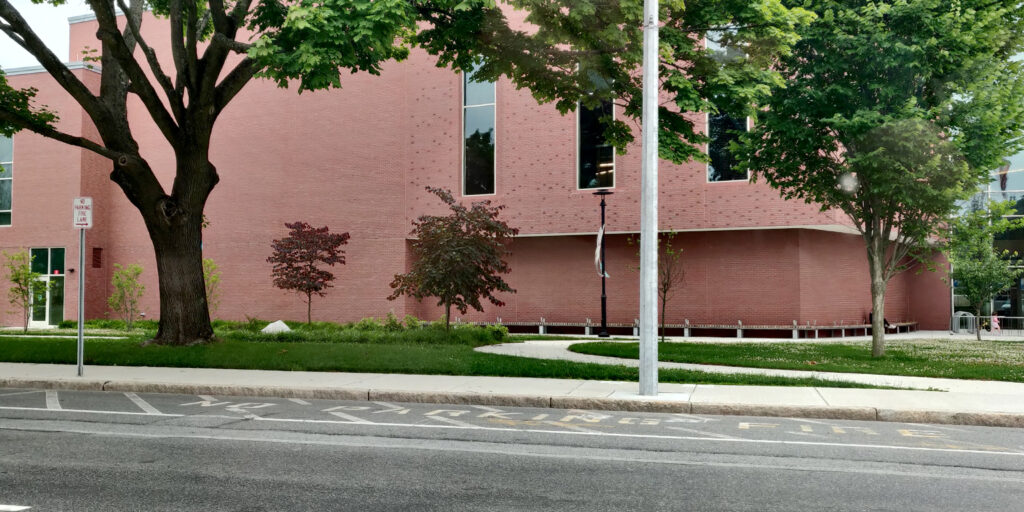
Promote public safety and accessibility
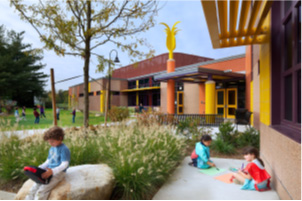
Often, portions of the curb are set aside for public safety purposes. For example, a fire lane provides fire department access to key buildings, such as the high school, shown below. Fire hydrants also enjoy special curb status.
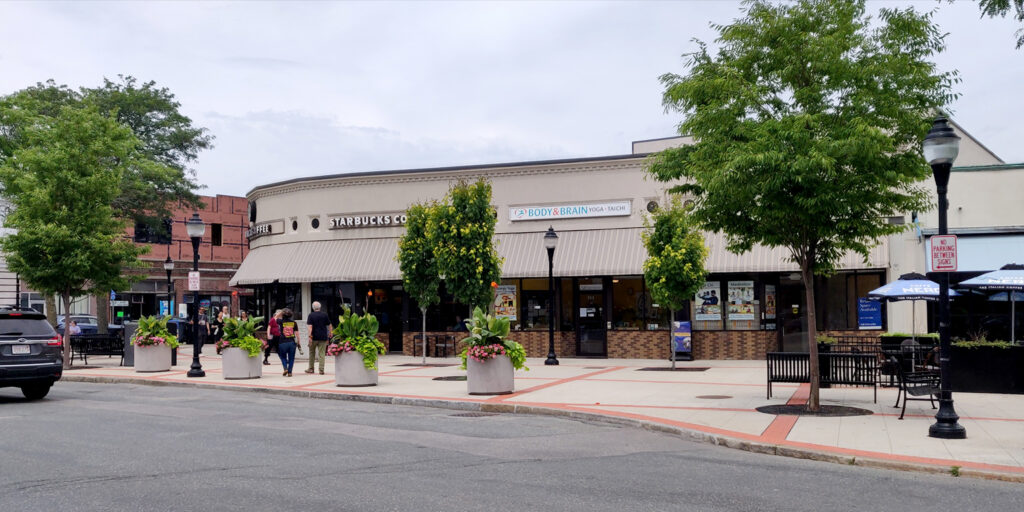
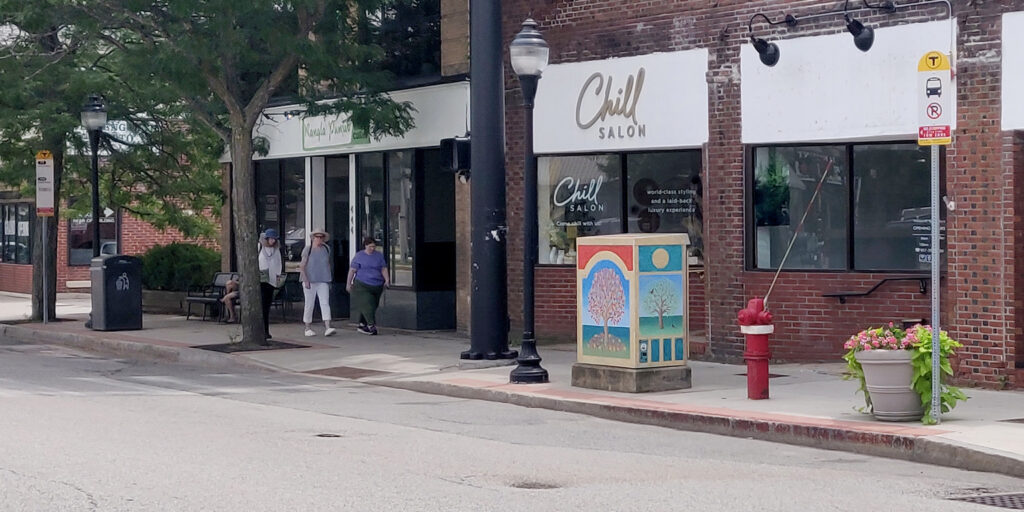
Other times, no-parking zones are established to enhance the free flow of traffic, such as here at Broadway Plaza:
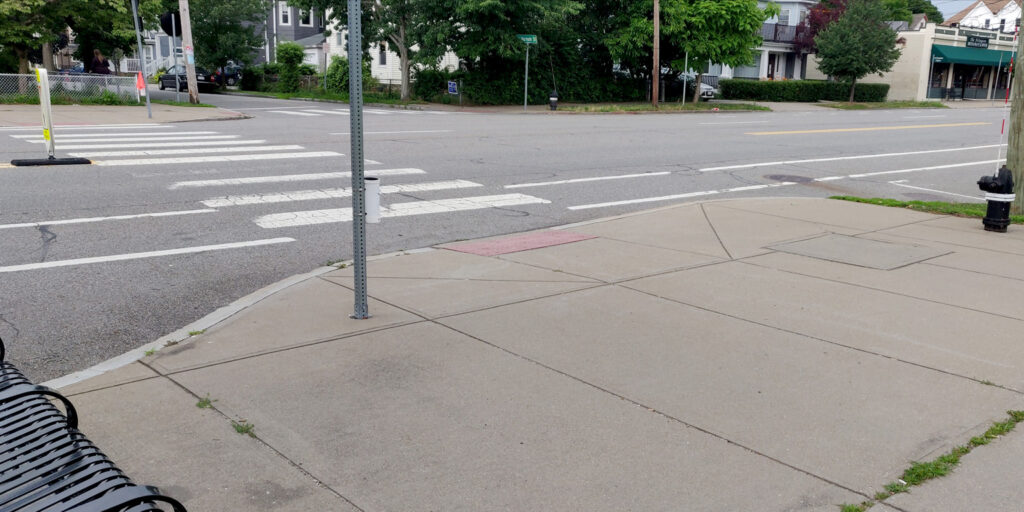
Where pedestrian crosswalks are present, a curb extension is a key safety enhancement. By narrowing the roadway, the curb extension encourages drivers to slow down and look for pedestrians. For pedestrians, it reduces the distance they must cross and prevents cars from parking directly next to the crosswalk and blocking visibility.
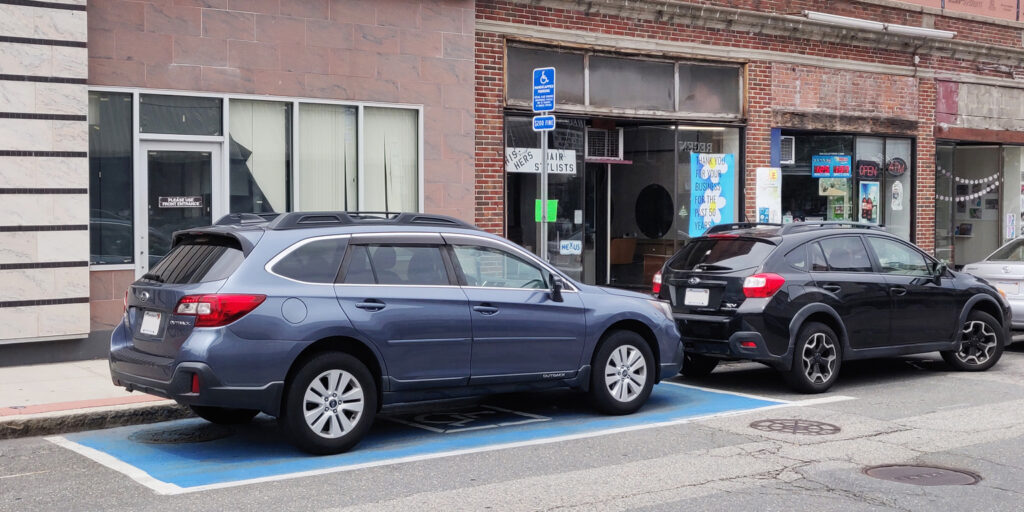
Finally, accessible parking spaces can be created along the curb. Arlington has at least 50 designated permit-only on-street parking spaces that provide convenient parking for residents with mobility issues or other disabilities.
Support sustainable transportation
When the curb is mostly used for cars, it is easy to overlook how curbside facilities can enhance other forms of transportation.
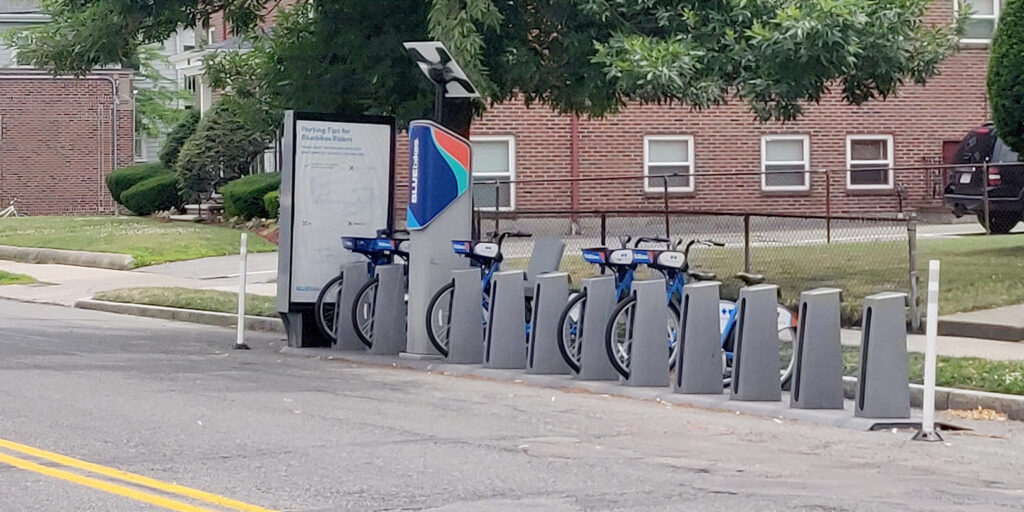
In the space of one or two parked cars, this bikeshare station offers space for 11 bikes. However, because it is installed on the roadway, it must be removed every winter so that snow can be cleared. If the curb were extended, the bikeshare station could be used year-round. Another nice feature is bicycle parking: the space to park one car can be used to park six or more bicycles.
A bus stop allows buses to pull to the curb. In some cases, it is appropriate to extend the curb so the bus would stop in the traffic lane; otherwise, it may experience delays when it merges back into traffic.
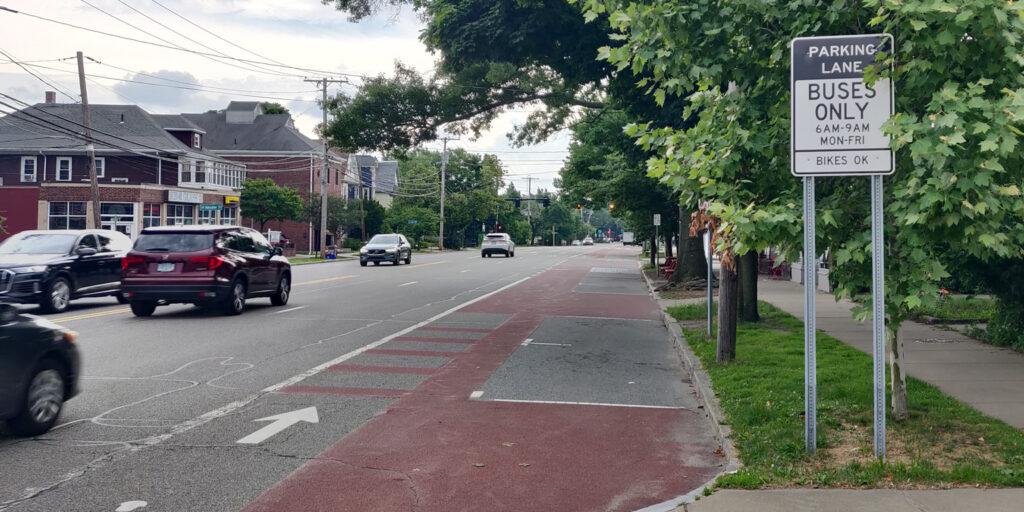
A bus priority lane provides a dedicated right of way for buses, helping to improve on-time performance. To date, these lanes extend only a few hundred feet into Arlington along Mass Ave. They have proven beneficial in many other communities.
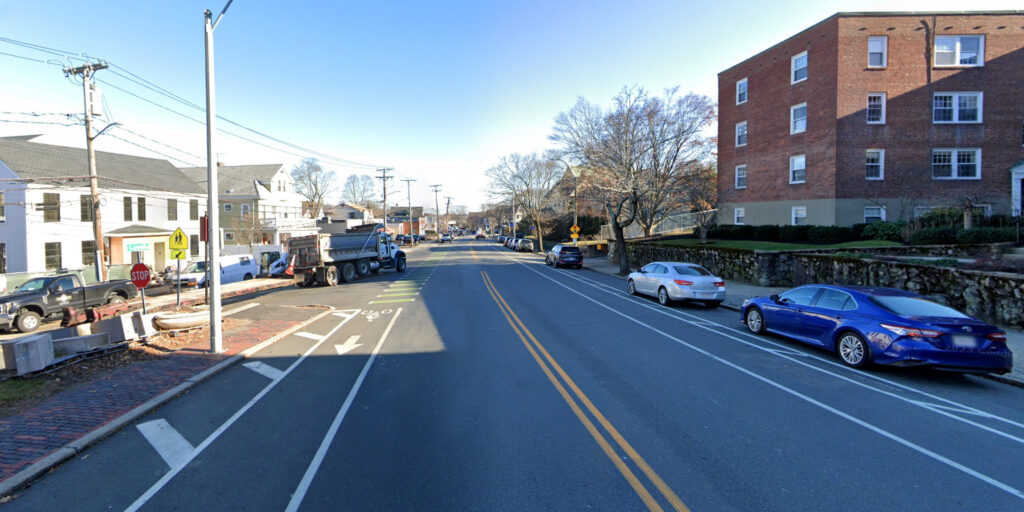
Bike lanes, particularly if they are separated from cars by a physical buffer, greatly enhance the safety and comfort of people traveling on two wheels.
But with a limited roadway width, adding bike lanes is difficult unless the community is flexible enough to consider consolidating curb parking on one side of the street, or moving it to side streets entirely.
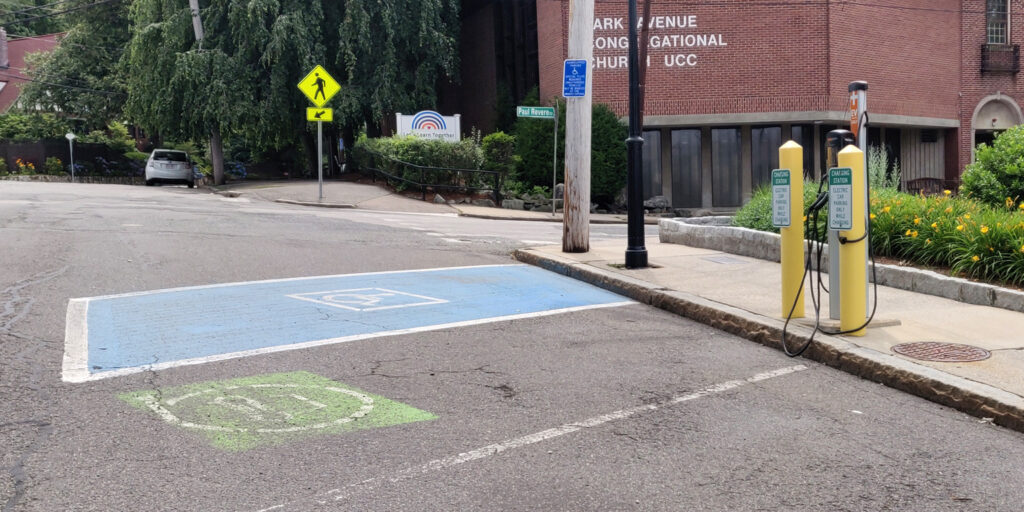
Finally, the Town could expand the use of on-street spaces for electric vehicle charging stations, such as this one on Park Ave:
Strengthen business districts
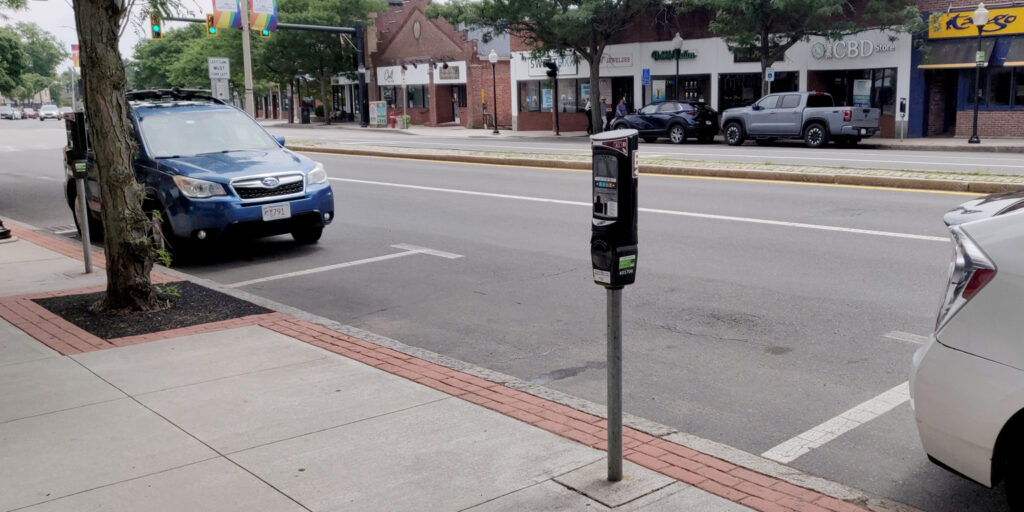
Nowhere is the curb more valuable than in business districts. Businesses thrive when their customers have a convenient way to reach them. Metered parking encourages people to park, do their business, and move along so another patron can take that space. Revenue from parking meters can be spent to improve the business district–for example, by planting flowers and trees.
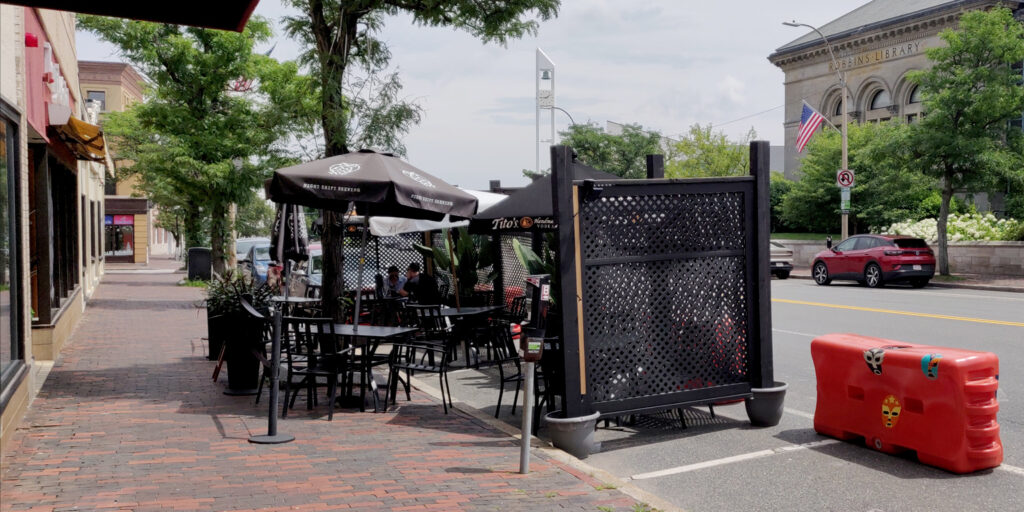
Metered parking is not the only valuable use of curb space in a business district. Outdoor dining is a way the Town can directly support its restaurants by enabling them to serve additional customers. Here is one example in Arlington Center:
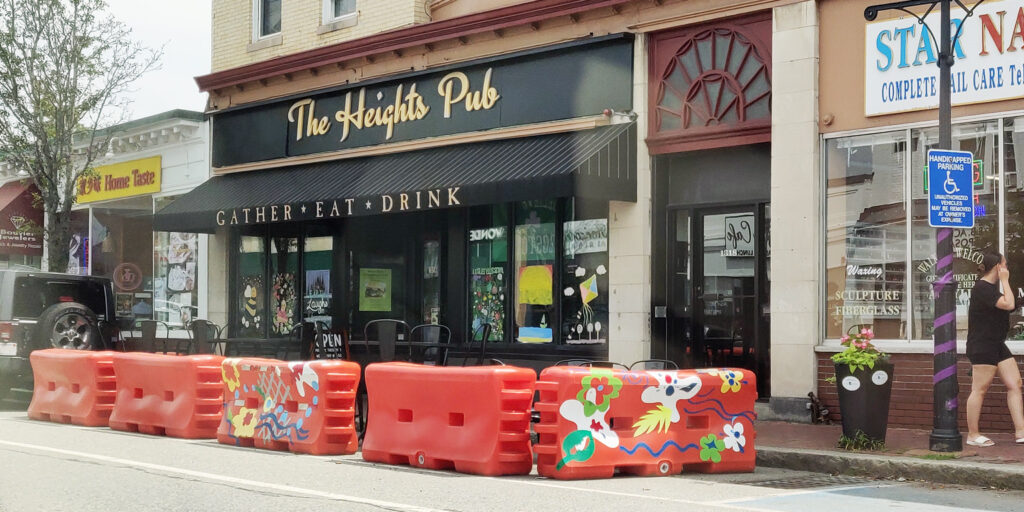
And in Arlington Heights:
Other valuable curb uses in business districts include taxi stands and loading zones. Loading zones in particular are crucial to businesses’ success and help prevent the street from being clogged by early-morning delivery trucks, late-night food-delivery vehicles, and everything in between.
Enable new ‘car-light’ development
With high housing costs and a relatively small commercial tax base, Arlington could benefit from some kinds of development. However, land is valuable and lots are small, so if new buildings are required to have large parking lots, it is very difficult to build new homes and businesses. Plus, large parking lots bring more cars and more traffic. But better curb management can help resolve this dilemma, supporting car-light development that is more sustainable and affordable.
For example, on-street permit parking can enable nearby development with few or no off-street parking spaces. New housing or businesses are a better use of land than parking and will generate more property tax revenue. When parking permits are priced appropriately, they are available to residents who need them but discourage households from adding extra cars they do not need.
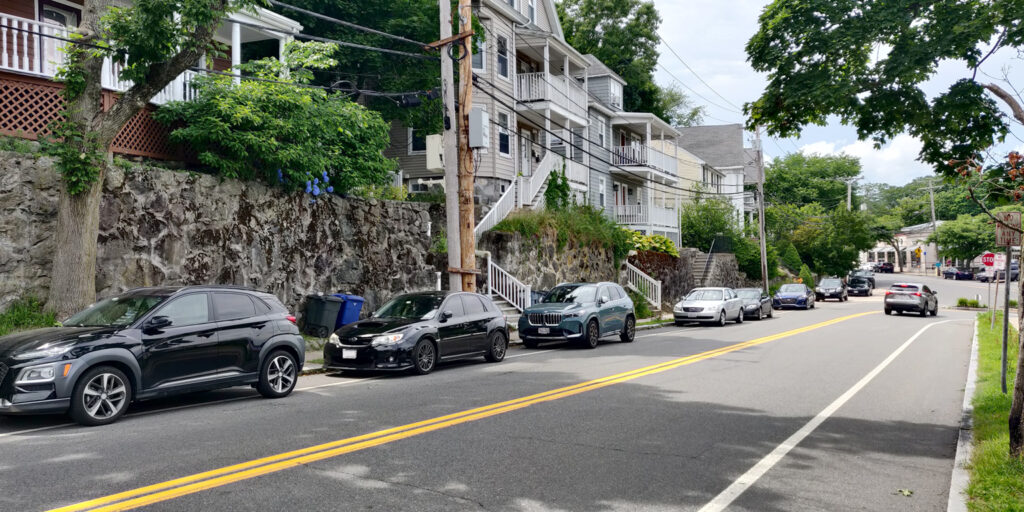
Take these hillside houses: access to on-street parking made it possible to build on a steep hillside, where it would have been too expensive and difficult to blast to create off-street parking.
Conclusion
Ask your town leaders if they have a curb management strategy. Is the Town using its limited curb space in support of goals such as green infrastructure, public safety and accessibility, public transportation, local business, and car-light development?
Prepared by: Barbara Thornton with the capable assistance of Alex Bagnall, Pamela Hallett, Patrick Hanlon, Karen Kelleher, Steve Revilak and Jennifer Susse.
As Arlington considers new zoning and other policy decisions to increase the amount of affordable housing in the town, a concern has been raised about the threat of greater costs to the Town’s budget from new people with school age children moving into the town. The concern: additional children in the public schools costs the town more than the additional new property tax revenue the Town collects from the new housing.
This post examines this concern, drawing on data from two recent housing developments, representing 283 units of housing in Arlington, to determine that actually the Town budget gains over 4.5 times the actual cost of paying for the students. According to the most recent 2020 tax bills, the Town expects to collect $1,250,370 in revenue and to spend an additional $269,589 for the new Arlington Public School students living in these developments.
The data suggests that the fear of increased school costs, overwhelming the potential new revenue from new housing construction is not warranted.
For more information, see the full post here.
Welcome to the redesigned Equitable Arlington website! We know that Arlington values openness and diversity, a greener future, and vibrant neighborhoods and downtowns—but our current zoning is holding us back. We’re advocating for change because we recognize that the choices we make on zoning and housing policy are key to living those values. We are committed to strengthening our community through respectful dialogue and by listening to our neighbors. Our aim with this site redesign is to share accurate and relevant information to help inform such conversations.
With this redesigned site we have:
- Answered some of the most common questions that have come up in our conversations with other residents.
- Created a zoning dictionary with explanations of many of the terms that pepper zoning discussions.
- Gathered a list of resources, where you’ll find everything from short explainer videos to detailed research
- Developed a history of zoning timeline that shows how Arlington’s history fits into the larger context of government actions.
If you’re not familiar with us, I hope you’ll take a minute to read our mission and why our work matters. I also hope you’ll scroll through to meet us, see some of our smiling faces, and read in our own words why we do this work. We’re renters and homeowners, long time residents and newcomers to town who come to this work with a variety of viewpoints and lived experiences!
We believe Arlington can be a leader in the greater Boston area by the choices we make to create more equitable housing policy. Our local actions have effects that go beyond our borders. Arlington has recognized our power to make an impact and has been a regional leader on many issues.
We can channel this same energy and our values to make sure Arlington has the vibrant sustainable and equitable future we all want. To succeed, we need engaged residents who understand the issues, who can balance competing interests, and who are willing to do the necessary hard work. Please join us in building a more equitable Arlington!