Many issues are under discussion as a result of these proposed zoning Articles. Issues include: housing affordability, the diversity of housing and incomes in Arlington, environmental concerns and sustainability, tax burdens or tax savings potentially resulting from growth, the risk of postponing the decisions, and the image of Arlington as a community that values diversity and equitability. This one page “fact sheet” attempts to address many of these issues and concerns.
Related articles


by Andy Greenspon
Image credit: Henry Hudson Kitson, Public domain, via Wikimedia Commons
In 2023, Lexington was one of the first towns to comply with the State “MBTA Communities” law (MBTA-C) by adding 227 acres to several multifamily overlay zones. When discussing this proposal, it was estimated to possibly generate 400-800 units in 4-10 years. However, after receiving building permit applications for about 1,100 units in the first year (including 160 inclusionary affordable units), Lexington passed Article 2 at a Special Town Meeting recently, which decreased the amount of land in these zones to approximately 90 acres. What can Arlington learn from Lexington’s experience?
Overall, Lexington’s experience shows us that developers are willing and able to build multifamily housing on large lots that aren’t very built up, and that MBTA-C can be successful in adding new housing in some circumstances. However, Arlington has few if any large, sparsely-built parcels zoned to allow multifamily housing under MBTA-C. As such, Arlington is unlikely to add significant amounts of new housing or affordable housing as a result of the MBTA-C overlay passed at Town Meeting in fall of 2023.
Parcel Size and Existing Buildings
Many of the parcels in Lexington’s MBTA-C zone are multiple acres each, are underutilized, and contain older office space. In contrast, Arlington’s MBTA-C parcels are much smaller and mostly covered with existing buildings, typically residential.
The largest development approved under MBTA-C so far in Lexington is at 3-5 Militia Drive. This land is three very large parcels containing a couple older office buildings, a previous religious institution, and giant surface parking lots. Therefore, such a property was already primed for redevelopment and the large lots allowed for 292 units to be approved. These parcels are also within walking distance of Lexington Town Center and the Minuteman Bike path, so multi-family housing on this location is a great use.
In contrast, there are no similar parcels in Arlington in the MBTA-C zone with large surface parking lots and aged office space that could be redeveloped in such a manner. One of the few parcels in Arlington that is somewhat similar to the planned parcels for redevelopment in Lexington would be the Walgreens at 324 Massachusetts Ave, 1.5 acres with a surface parking lot. However, this parcel was specifically excluded from the MBTA-C overlay along with all other business parcels to avoid displacing any existing business space. And the parcel is unlikely to be redeveloped one way or another unless Walgreens chooses to close their business and sell the parcel to a developer.
In short, compared to Lexington, Arlington is “built out” insofar as almost every parcel is utilized in some manner with high lot coverage. The original Lexington MBTA-C zone contained many parcels with low lot coverage, large surface parking lots, and underutilized office space, all attributes that make such parcels more likely to be sold to a developer to construct housing if permitted by zoning.
Last, while 1,100 units have been permitted so far, this does not mean all these units will be constructed given current financial uncertainty in the economy and high interest rates. It will also take several years for these properties to be completed and prepared for occupancy. As such, the original estimate of 400-800 units in 4-10 years (an estimate that actually widely ranges from 40 units all the way to 200 units per year) may in fact not be that far off from the final numbers once buildings are completed. The parcels most primed for redevelopment were acquired and permitted first. Finally, it is not entirely clear how many more parcels would have been redeveloped in the next 5-10 years had the Lexington MBTA-C zoning not been reduced in size.
Development Potential in Arlington
Most privately owned lots in Arlington are less than ⅓ of an acre with many much smaller, significantly limiting the amount of new housing development on any single parcel. Almost all of these lots are covered by existing buildings, and some of those buildings are condominiums. Therefore, in order for a large new construction project to occur on such parcels in Arlington’s MBTA-C multifamily zone, all of the following would have to take place:
- a single owner would have to take control of multiple lots and/or condominiums, meaning that
- multiple existing property owners would have to want to sell at the same time, or else the new owner would have to take the time and risk to assemble the property slowly, and
- the new proposed development would have to be large and profitable enough to make up for the combined purchase prices of all the properties acquired.
Meanwhile, properties in Arlington generally turn over at a fairly slow and steady pace. This is in contrast to underused large commercial properties, whose owners are more eager to sell.
With simulation modeling performed on potential rate of redevelopment, the Arlington Redevelopment Board’s 2023 Report to Town Meeting on the MBTA-C proposal projected that 15–45 parcels could be redeveloped over the next ten years, for a net increase of 50–200 new units or 5–20 per year, far fewer than even the initial Lexington housing unit construction estimates at the time of passage of their initial MBTA-C zoning.
In fact, Arlington has seen even less than the low end estimate of 5 units per year so far since our MBTA-C zoning became effective. Only a single project has been permitted so far, which would turn an existing 2-unit building into 4 units, a potential net gain of 2 housing units.
Lessons
- There is strong regional demand for housing including for multifamily units.
- Developers are currently willing and able to build when lots are available, are zoned multifamily, and aren’t already full of other buildings.
- Arlington can’t expect anywhere near as many new units with our current zoning as Lexington saw, because our MBTA-C multifamily zones are almost exclusively made up of smaller and built-up lots.
- As a result, Arlington’s current zoning won’t add much housing or affordable housing to our community, and won’t noticeably increase our tax base either.
This timely report on the question of affordable housing vs. density comes from the California Dept. of Housing & Community Development and mirrors the situation in the region surrounding Arlington MA.
Housing production has not kept up with job and household growth. The location and type of new housing does not meet the needs of many new house- holds. As a result, only one in five households can afford a typical home, overcrowding doubled in the 1990’s, and too many households pay more than they can afford for their housing.
Myth #1
High-density housing is affordable housing; affordable
housing is high-density housing.
Fact #1
Not all high density housing is affordable to low-income families.
Myth #2
High-density and affordable housing will cause too much traffic.
Fact #2
People who live in affordable housing own fewer cars and
drive less.
Myth #3
High-density development strains public services and
infrastructure.
Fact #3
Compact development offers greater efficiency in use of
public services and infrastructure.
Myth #4
People who live in high-density and affordable housing
won’t fit into my neighborhood.
Fact #4
People who need affordable housing already live and work
in your community.
Myth #5
Affordable housing reduces property values.
Fact #5
No study in California has ever shown that affordable
housing developments reduce property values.
Myth #6
Residents of affordable housing move too often to be stable
community members.
Fact #6
When rents are guaranteed to remain stable, tenants
move less often.
Myth #7
High-density and affordable housing undermine community
character.
Fact #7
New affordable and high-density housing can always be
designed to fit into existing communities.
Myth #8
High-density and affordable housing increase crime.
Fact #8
The design and use of public spaces has a far more
significant affect on crime than density or income levels.
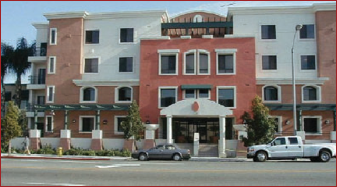
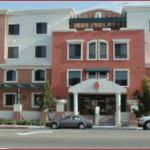
See an example of a “case study” of two affordable housing developments in Irvine CA, San Marcos at 64 units per acre.
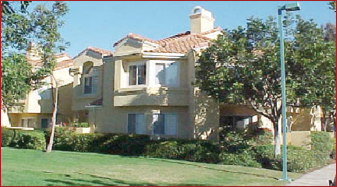
San Paulo at 25 units per acre.

Both are designed to blend with nearby homes.
Welcome to the redesigned Equitable Arlington website! We know that Arlington values openness and diversity, a greener future, and vibrant neighborhoods and downtowns—but our current zoning is holding us back. We’re advocating for change because we recognize that the choices we make on zoning and housing policy are key to living those values. We are committed to strengthening our community through respectful dialogue and by listening to our neighbors. Our aim with this site redesign is to share accurate and relevant information to help inform such conversations.
With this redesigned site we have:
- Answered some of the most common questions that have come up in our conversations with other residents.
- Created a zoning dictionary with explanations of many of the terms that pepper zoning discussions.
- Gathered a list of resources, where you’ll find everything from short explainer videos to detailed research
- Developed a history of zoning timeline that shows how Arlington’s history fits into the larger context of government actions.
If you’re not familiar with us, I hope you’ll take a minute to read our mission and why our work matters. I also hope you’ll scroll through to meet us, see some of our smiling faces, and read in our own words why we do this work. We’re renters and homeowners, long time residents and newcomers to town who come to this work with a variety of viewpoints and lived experiences!
We believe Arlington can be a leader in the greater Boston area by the choices we make to create more equitable housing policy. Our local actions have effects that go beyond our borders. Arlington has recognized our power to make an impact and has been a regional leader on many issues.
We can channel this same energy and our values to make sure Arlington has the vibrant sustainable and equitable future we all want. To succeed, we need engaged residents who understand the issues, who can balance competing interests, and who are willing to do the necessary hard work. Please join us in building a more equitable Arlington!