Related articles
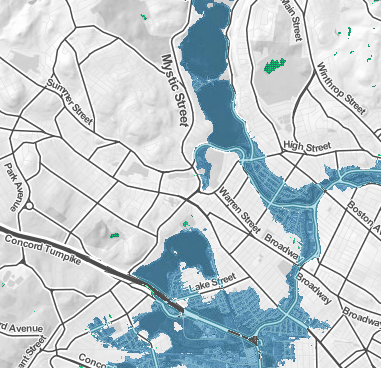
Climate Central’s Surging Seas global Risk Zone Map provides the ability to explore inundation risk up to 30 meters across the world’s coastlines as well as local sea level rise projections at over 1,000 tide gauges on 6 continents.
Set the map for Boston MA and focus in on the Arlington area to see how the town would be affected by rising sea levels, as predicted over the next few decades.
Map areas below the selected water level are displayed as satellite imagery shaded in blue indicating vulnerability to flooding from combined sea level rise, storm surge, and tides, or to permanent submergence by long-term sea level rise. Map areas above the selected water level are shown in map style using white and pale grays. The map is searchable by city, state, postal code, and other location names. The map is embeddable, and users can customize and download map screenshots using the camera icon in the top right of the screen.
For map areas in the U.S., the Risk Zone map incorporates the latest, high-resolution, high-accuracy lidar elevation data supplied by NOAA, displays points of interest, and contains layers displaying social vulnerability and population density. For map areas outside the U.S. the map utilizes elevation data from NASA’s Shuttle Radar Topography Mission (SRTM).
According to Richard Rothstein in his 2017 book, Color of Law: A Forgotten History of How Our Government Segregated America, “we have created a caste system in this country, with African-Americans kept exploited and geographically separate by racially explicit government policies,” he writes. “Although most of these policies are now off the books, they have never been remedied and their effects endure.” Zoning was one of the policies that contributed significantly to this outcome.
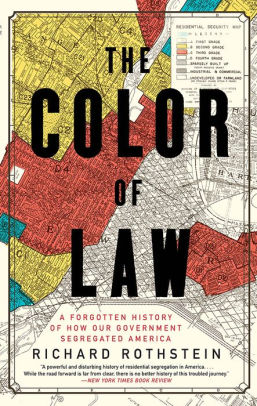
Here are some highlights, selected for Arlington readers, from this book:
P. VII
“… until the last quarter of the twentieth century, racially explicit policies of federal, state and local governments defined where white and African Americans should live. Today’s racial segregation in the North, South, Midwest, and West is not the the unintended consequence of individual choices and of otherwise well-meaning law and regulation but of unhidden public policy that explicitly segregated every metropolitan area in the United States. The policy was so systematic and forceful that is effects endure to the present time. Without our government’s purposeful imposition of racial segregation, the other causes – private prejudice, white flight, real estate starring, bank redlining, income differences, and self-segregation – still would have existed but with far less opportunity for expression. Segregation by intentional government action is not de facto. Rather, it is what courts call de jure: segregation by law and public policy. “
1917 – Buchanan v. Warley – Supreme Court case that overturned racial zoning ordinance in Louisville, Kentucky. Municipalities ignore and fought against this. Kansas City and Norfolk through 1987.
- Post WWII GI Bill – African Americans largely excluded from education and mortgage benefits
- Federal Housing Administration won’t insure mortgages to African Americans or mortgages in integrated neighborhoods. African Americans limited to non-amortizing loans, which means they build no equity in their homes while making payments
- Federal, stage and local governments are used to enforce race-restrictive covenants in deeds.
1948 – Shelley v. Kraemer – Although racially restrictive real estate covenants are not per se illegal, since they do not involve state action, a court cannot enforce them under the Fourteenth Amendment. FHA continues to not insure mortgages for African Americans.
1968 – Fair Housing Act endorsed the rights of African Americans to to reside wherever they chose and could afford. Finally ending the Federal Housing Administration’s’ role in mortgage insurance discrimination.
1969 – Mass 40B law passed
1972 – Head of Arlington ARB editorial talking about preserving the suburban way of life
1973 – Town Meeting passes moratorium on apartment construction
1975 – Arlington zoning re-do that all but stops development
1977 – Supreme Court upholds Arlington Heights, IL zoning that prohibited multi-unit development anywhere by adjacent to an outlying commercial area. In meetings leading to the adoption of these rules, the public urged support for racially discriminatory reasons.
p. 179″Residential segregation is hard to undo for several reasons:
- Parents’ economic status is commonly replicated in the net generation, so once government prevented African Americans from fully participating in the mid-twentieth-century free labor market, depressed incomes became, for many, a multi-generational trait
- The value of white working and middle-class families’ suburban housing appreciated substantially over the years, resulting in a vast wealth difference between whites and blacks that helped to define permanently our racial living arrangements. Because parents can bequeath assets to their children, the racial wealth gap is even more persistent down through the generations than income differences.
- Once segregation was established, seemingly race-neutral policies reinforced it to make remedies even more difficult. Perhaps most pernicious has been the federal tax code’s mortgage interest rate deduction, which increased the subsidies to higher-income suburban homeowners while providing no corresponding tax benefit for renters. Because de jure policies of segregation ensured that whites would be more likely to be owners and African Americans would more likely be renters, the tax code contributes to making African Americans and whites less equal, despite the code’s purportedly nonracial provisions.