It’s New Year’s eve and I’m determined to get my third and final “Arlington 2020” article written and posted before 2021 rolls in. I’ve written these articles to paint a picture of Arlington’s housing stock, and how our housing costs have changed over time. The first article looked at the number of one-, two-, and three-family homes and condominiums in Arlington. The second article looked at how the costs of these homes has varied over time.
In this article, I’m going to look at the per-unit costs for our different housing types. The per-unit cost is just the assessed value, divided by the number of units. For condos and single-family homes, the unit cost is simply the assessed value. For two-family homes, it’s the assessed value divided by two. For a ten-unit apartment building, it’s the assessed value divided by ten. We’ll look at the price ranges within housing types, as well as the general differences between them.
The information here doesn’t include residential units from Arlington’s 76 mixed-use buildings. (My copy of the assessor’s data doesn’t distinguish between residential and commercial units in these buildings; I’ll try to say more about them in 2021.) It also omits units owned by the Arlington Housing Authority.
Condominiums
Condominiums provide the most variety and cost diversity. A condo can be half of a duplex, or part of a much larger multi-family building. The low end of the scale tends to be 500–600 square foot units that were built in the 1960’s; the high end tends to be more spacious new construction.
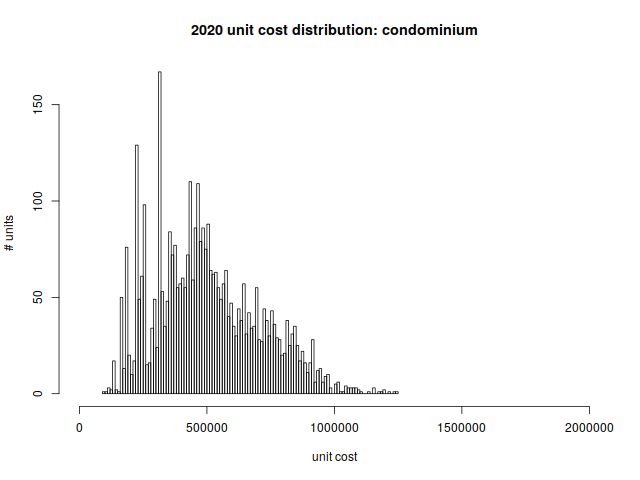
This graph is a histogram, as are the others in this article. The horizontal axis shows cost per unit, and the vertical axis shows the number of units in each particular cost band.
The per-unit price distribution is
| min | 1st quartile | median | mean | 3rd quartile | max |
| $92,600 | $344,450 | $473,100 | $500,086 | $640,850 | $1,241,000 |
Single-family homes
Single family homes are heavily concentrated around the $700,000 mark. There’s very little available for less than a half million dollars.
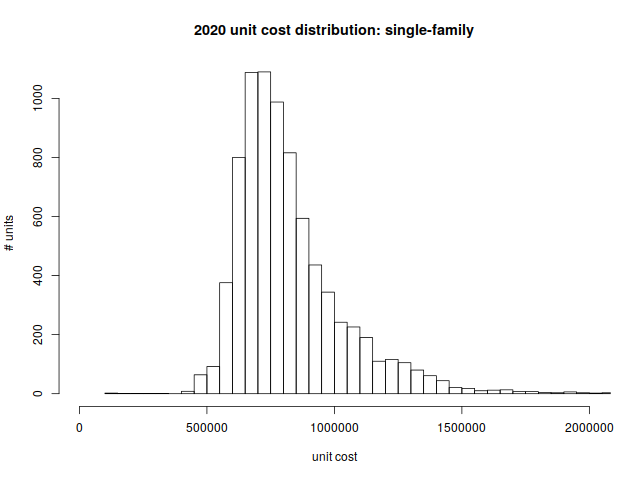
Per unit rice distribution:
| min | 1st quartile | median | mean | 3rd quartile | max |
| $103,700 | $679,900 | $771,900 | $825,172 | $908,750 | $3,232,700 |
The $103,700 single-family home deserves some explanation. The property straddles the border between Arlington and Lexington; it appears that the $103k assessed value reflects the portion that lies in Arlington.
Two-family Homes
Two-family homes are the bread and butter of East Arlington; they’re also common in the blocks off Mass ave near Brattle Square and the heights. Many of these homes are older and non-conforming, and they’re gradually being renovated and turned into condominiums.
As a reminder, these are costs per unit (as opposed to the cost of the entire two-family home).
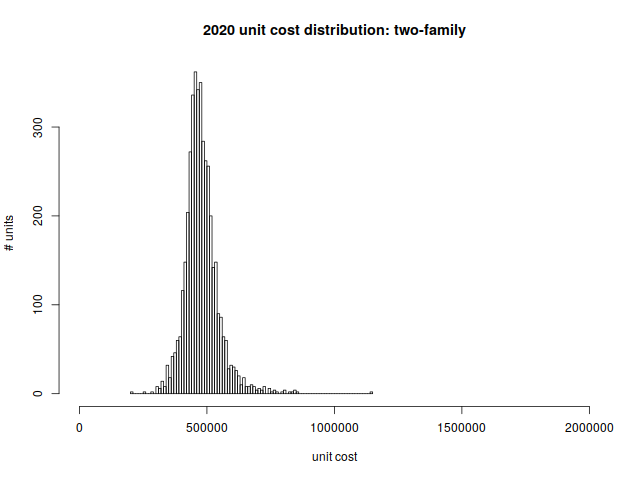
Per unit price distribution:
| Min | 1st quartile | median | mean | 3rd quartile | max |
| $209,050 | $440,550 | $472,000 | $479,175 | $508,588 | $1,140,450 |
Three-family Homes
Unlike Dorchester and Somerville, three-family homes are not a staple of Arlington’s housing stock. But we have a few of them. Most were built between 1906 and 1930.
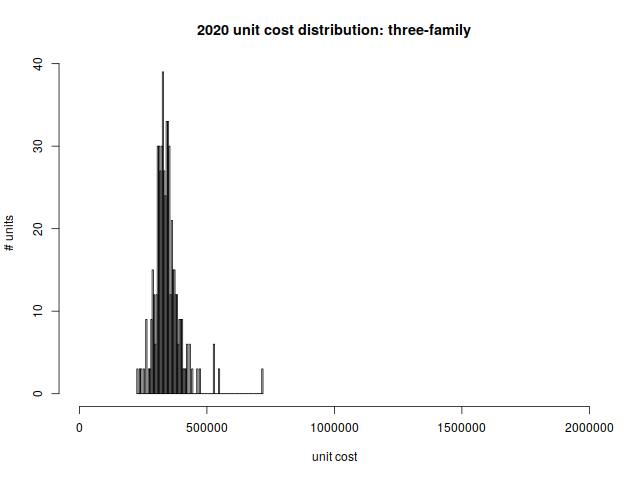
Per-unit price distribution:
| Min | 1st quartile | median | mean | 3rd quartile | max |
| $227,567 | $313,733 | $336,950 | $344,292 | $362,600 | $719,000 |
Small Apartments (4–8 units)
The majority of Arlington’s small apartment buildings were constructed during the first half of the 20th century. The most recent one dates from 1976.
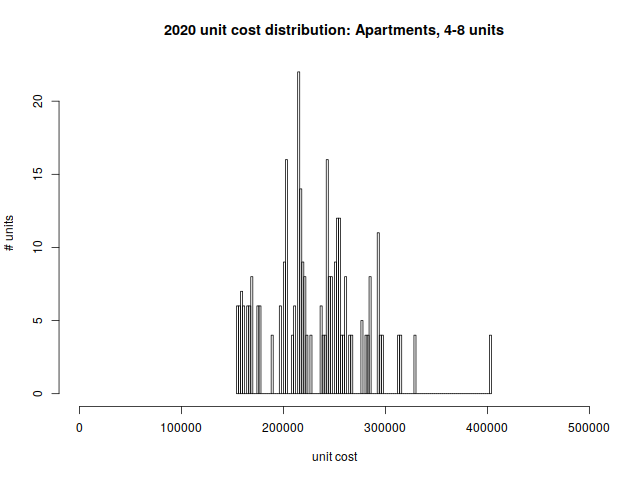
Per-unit price distribution:
| Min | 1st quartile | median | mean | 3rd quartile | max |
| $154,950 | $202,950 | $227,775 | $231,619 | $255,775 | $403,875 |
Large Apartments (9+ units)
You’ll see three outliers in the per unit-cost distribution for large apartment buildings. These correspond to the newest apartment complexes in Arlington: The Legacy (2000), Brigham Square (2012), and Arlington 360 (2013).
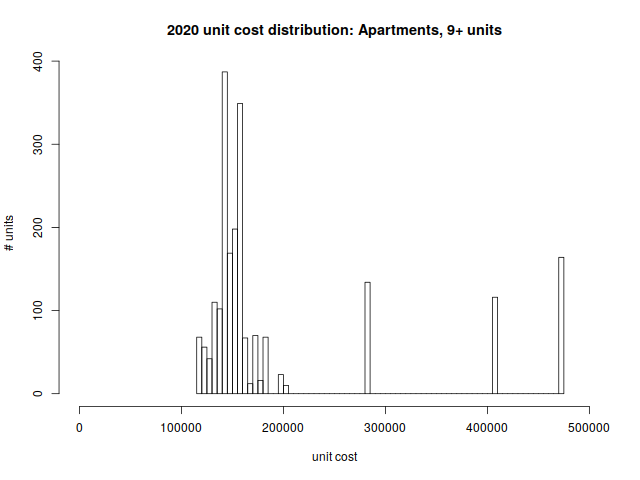
Per-unit price distribution:
| Min | 1st quartile | median | mean | 3rd quartile | max |
| $117,013 | $141,383 | $153,006 | $195,789 | $170,973 | $474,631 |
All combined
Finally, we’ll put it all together in one picture, representing nineteen-thousand and some odd homes in town.
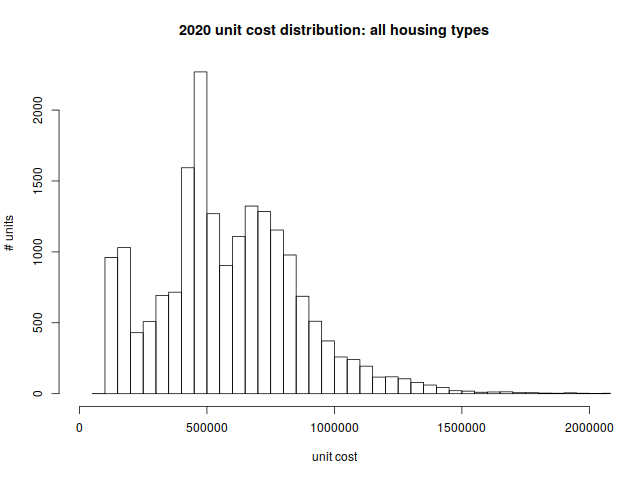
Per-unit price distribution:
| Min | 1st quartile | median | mean | 3rd quartile | max |
| $92,600 | $417,175 | $555,825 | $587,975 | $759,900 | $3,232,700 |
While there are lower-priced options available, a person coming to Arlington should expect to buy (or rent) a property that costs just shy of half a million dollars (or more).
Here is a spreadsheet with the cost distributions mentioned in this article.

