The citizen participation process including presentations, discussions, public hearings, letters and comments has been long and arduous. The issues are complicated and sometimes feelings run high. In such situations, there can be a feeling that citizens have not been heard. This document, “Guide to Zoning Amendments Related to Multifamily Uses and Mixed-Use“, summarizes many of the issues that have been raised and the changes that have been made in the zoning Articles as a result of the citizen participation in the public review process. Citizens have been heard.
Related articles
from Karen Kelleher, Reporter
Interested in new policy developments on housing production in the Greater Boston area? The latest research from Mass Housing Partnership (MHP) is of interest. They just released (Dec. 18, 2019) in interactive map showing relative housing density around every mass transit and commuter rail station in the system, concluding that the region could add 235,000 units if every community allowed density as of right in the area around transit.
CHAPA has legislation pending that would require municipalities served by transit to allow higher density as of right within a certain distance from transit stations. You’ll see that the density around Alewife is not too bad in the context of the entire system.
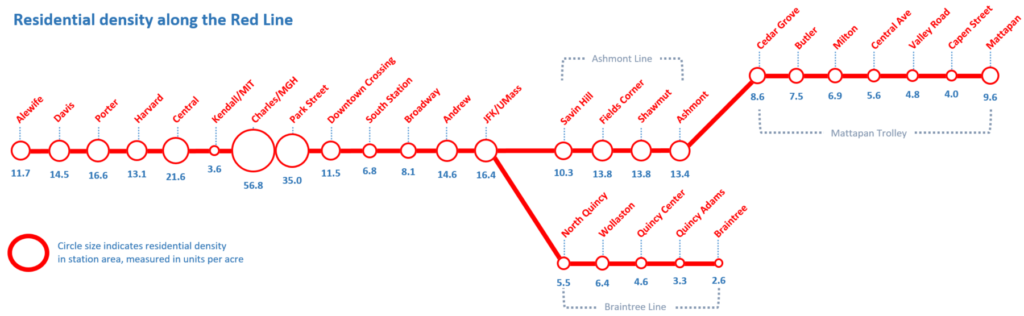
This is mostly because of very high density in Cambridge near Alewife, but the density of two and three families in East Arlington shows better housing density than the sea of single family zoning around many commuter rail stops.
You can check it out here:https://www.mhp.net/news/2019/todex-research-brief
(published June, 2019)
Overview
To solve the extraordinarily large deficit in housing for the greater Boston region, over 180,000 units of new housing should come on line in the next few years. This deficit is the result of a rapid expansion in in-migration due to new job creation, with no commensurate increase in housing production for the people taking those new jobs.
The report concludes that zoning is a primary culprit in restricting the development of an adequate housing supply, creating a “PAPER WALL” keeping out newcomers. The cost of this inadequate supply is a huge demand for housing which, in turn, bids up the price for available housing. The following “culprits” are considered: inadequate land area zoned for multi-family housing; low density zoning; age restrictions and bedroom restrictions; excessive parking requirements; mixed use requirements and approval processes. Alternative zoning models are suggested.
Elements such as “Approval Process”, “Mixed Use”, “Village Centers vs Isolated Parcels” and “Building Up or Building Out” are considered.
Researcher Amy Dain reports on two years of research into the regulations, plans and permits in the 100 cities and towns surrounding Boston. The research was commissioned by the Massachusetts Smart Growth Alliance and funded collaboratively with: Citizens’ Housing and Planning Association, Home Builders & Remodelers Association of Massachusetts, Massachusetts Association of Realtors, Massachusetts Housing Partnership, MassHousing, and Metropolitan Area Planning Council.
For the full report see: https://ma-smartgrowth.org/wp-content/uploads/2019/06/03/FINAL_Multi-Family_Housing_Report.pdf
For a power point slide presentation see: https://ma-smartgrowth.org/wp-content/uploads/2019/06/04/DainZoningMFPresentationShare2019.pdf
For the Executive Summary see: https://equitable-arlington.org/wp-content/uploads/2019/07/June-2019-Multi-Family-Housing-Report_Executive-Summary.pdf
Dave Weinstock, an Arlington resident interested in affordable housing wondered about the concept of “developer math”. The math involved in planning an affordable housing projects is a problem that needs to get solved in order to have anything built here in Arlington, or anywhere. This topic comes up frequently in community discussions about the need for more housing.
Questions are raised around:
- 1- Why build so many units vs. smaller buildings
- 2- Why parking is costly and inefficient use of land
- 3- Why can’t more affordable or all affordable units be built?
- 4- The cost of subsidizing affordable units and how that may translate to higher rental rates/costs, etc.
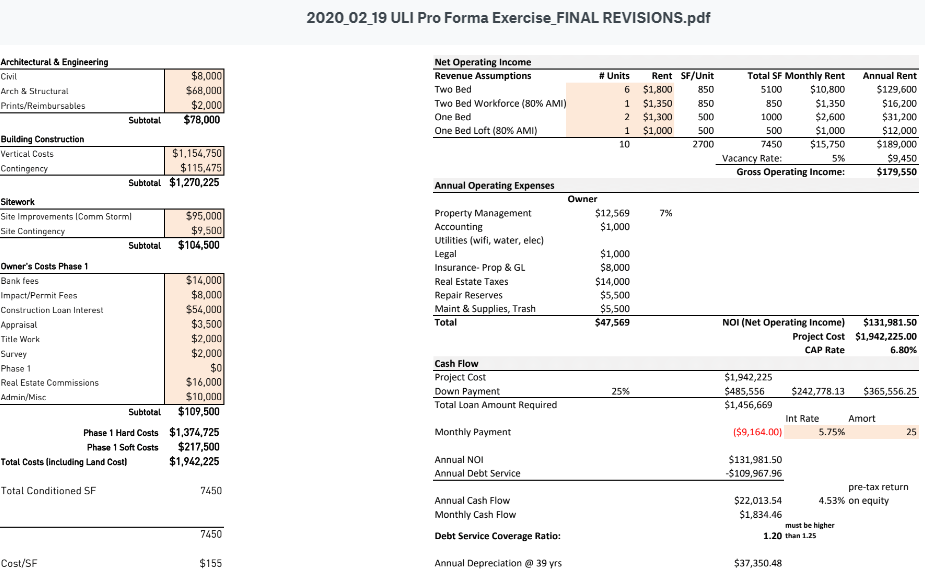
Dave found a great Architecture and Development firm in Atlanta (Kronberg Urbanists + Architects, based in Atlanta GA) that lays out a nice presentation, includes sample proformas, and real life scenarios that may help us understand this piece of the puzzle better when evaluating any project and how developers may be incented to build certain types of projects or do certain types of work.
Here is a link, reformatted to be within this website, to the presentation, showing the varieties of choices, costs, formulas and outcomes developers consider before deciding if the project can be built: https://equitable-arlington.org/developer-math_kua_071420/
Much of our hope for more affordable housing depends on the market forces of capitalism and the willingness of developers to build for good, not just for profit. But the developers must be able to cover their costs. Many communities are highly skeptical of developers, assuming the community will get tricked, the developer will get greedy and the promised housing will be a disappointment. Trust is needed. But so is verification. We all need to learn the developer math.
What are the math factors that a developer considers before deciding to build affordable housing?
Here is a link to the original presentation. https://www.kronbergua.com/post/mr-mu-let-s-talk-about-math