The new proposal is just the most recent step in a process that reaches back almost a decade, culminating in the Master Plan (2015), the Housing Production Plan (2016) and the mixed-using zoning amendments of 2016. The Town has consistently proposed smart growth: more development along Arlington’s transit corridors to increase the tax base, stimulate local commerce, and provide more varied housing opportunities for everyone, including low and moderate income Arlingtonians. This year’s proposals are no head-long rush into change. Today’s debate is similar to the debate before Town Meeting three years ago. If anything, progress has been frustratingly slow. To realize the Master Plan’s vision of a vibrant Arlington with diverse housing types for a diverse population, we must stay the course on which we have been embarked for so long.
Related articles
(published June, 2019)
Overview
To solve the extraordinarily large deficit in housing for the greater Boston region, over 180,000 units of new housing should come on line in the next few years. This deficit is the result of a rapid expansion in in-migration due to new job creation, with no commensurate increase in housing production for the people taking those new jobs.
The report concludes that zoning is a primary culprit in restricting the development of an adequate housing supply, creating a “PAPER WALL” keeping out newcomers. The cost of this inadequate supply is a huge demand for housing which, in turn, bids up the price for available housing. The following “culprits” are considered: inadequate land area zoned for multi-family housing; low density zoning; age restrictions and bedroom restrictions; excessive parking requirements; mixed use requirements and approval processes. Alternative zoning models are suggested.
Elements such as “Approval Process”, “Mixed Use”, “Village Centers vs Isolated Parcels” and “Building Up or Building Out” are considered.
Researcher Amy Dain reports on two years of research into the regulations, plans and permits in the 100 cities and towns surrounding Boston. The research was commissioned by the Massachusetts Smart Growth Alliance and funded collaboratively with: Citizens’ Housing and Planning Association, Home Builders & Remodelers Association of Massachusetts, Massachusetts Association of Realtors, Massachusetts Housing Partnership, MassHousing, and Metropolitan Area Planning Council.
For the full report see: https://ma-smartgrowth.org/wp-content/uploads/2019/06/03/FINAL_Multi-Family_Housing_Report.pdf
For a power point slide presentation see: https://ma-smartgrowth.org/wp-content/uploads/2019/06/04/DainZoningMFPresentationShare2019.pdf
For the Executive Summary see: https://equitable-arlington.org/wp-content/uploads/2019/07/June-2019-Multi-Family-Housing-Report_Executive-Summary.pdf
This timely report on the question of affordable housing vs. density comes from the California Dept. of Housing & Community Development and mirrors the situation in the region surrounding Arlington MA.
Housing production has not kept up with job and household growth. The location and type of new housing does not meet the needs of many new house- holds. As a result, only one in five households can afford a typical home, overcrowding doubled in the 1990’s, and too many households pay more than they can afford for their housing.
Myth #1
High-density housing is affordable housing; affordable
housing is high-density housing.
Fact #1
Not all high density housing is affordable to low-income families.
Myth #2
High-density and affordable housing will cause too much traffic.
Fact #2
People who live in affordable housing own fewer cars and
drive less.
Myth #3
High-density development strains public services and
infrastructure.
Fact #3
Compact development offers greater efficiency in use of
public services and infrastructure.
Myth #4
People who live in high-density and affordable housing
won’t fit into my neighborhood.
Fact #4
People who need affordable housing already live and work
in your community.
Myth #5
Affordable housing reduces property values.
Fact #5
No study in California has ever shown that affordable
housing developments reduce property values.
Myth #6
Residents of affordable housing move too often to be stable
community members.
Fact #6
When rents are guaranteed to remain stable, tenants
move less often.
Myth #7
High-density and affordable housing undermine community
character.
Fact #7
New affordable and high-density housing can always be
designed to fit into existing communities.
Myth #8
High-density and affordable housing increase crime.
Fact #8
The design and use of public spaces has a far more
significant affect on crime than density or income levels.
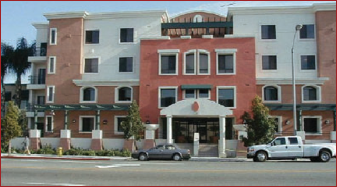
See an example of a “case study” of two affordable housing developments in Irvine CA, San Marcos at 64 units per acre.
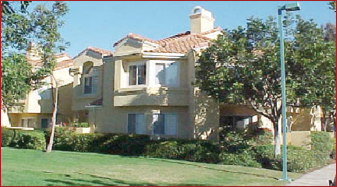
San Paulo at 25 units per acre.

Both are designed to blend with nearby homes.
Accessory Dwelling Units (aka “granny flats”)
The following information was presented to the Arlington Redevelopment Board in October, 2020 by Barbara Thornton, TMM, Precinct 16
This Article proposes to allow Accessory Dwelling Units, “as of right”, in each of the 8 residential zoning districts in Arlington.
Why is this zoning legislation important?
Arlington is increasingly losing the diversity it once had. It has become increasingly difficult for residents who have grown up and grown old in the town to remain here. This will only become more difficult as the effects of tax increases to support the new schools, including the high school, roll into the tax bills for lower income residents and senior citizens on a fixed income. For young adults raised in Arlington, the price of a home to buy or to rent is increasingly out of reach.
Who benefits from ADUs?
- Families benefit from greater flexibility as their needs change over time and, in particular providing options for older adults to be able to stay in their homes and for households with disabled persons or young adults who want additional privacy but still be within a family setting.
- Residents seeking an increase in the diversity of housing choices in the Town while respecting the residential character and scale of existing neighborhoods; ADUs provide a non-subsidized form of housing that is generally less costly and more affordable than similar units in multifamily buildings;
- Residents wanting more housing units in Arlington’s total housing stock with minimal adverse effects on Arlington’s neighborhoods.
What authority and established policy is this built on?
Arlington’s Master Plan is the foundational document establishing the validity and mission for pursuing the zoning change that will allow Accessory Dwelling Units.
Under Introduction in Part 5, Housing and Residential Development, the Master Plan states: Arlington’s Master Plan provides a framework for addressing key issues such as affordability, transit-oriented residential development, and aging in place.
The Master Plan states that the American Community Survey (ACS) reports that Arlington’s housing units are slightly larger than those in other inner-suburbs and small cities. In Arlington, the median number of rooms per unit is 5.7. There is a great deal of difference in density and housing size among the different Arlington neighborhoods. The generally larger size of homes makes it easier to contemplate a successful move to encourage ADUs.
What do other municipalities do?
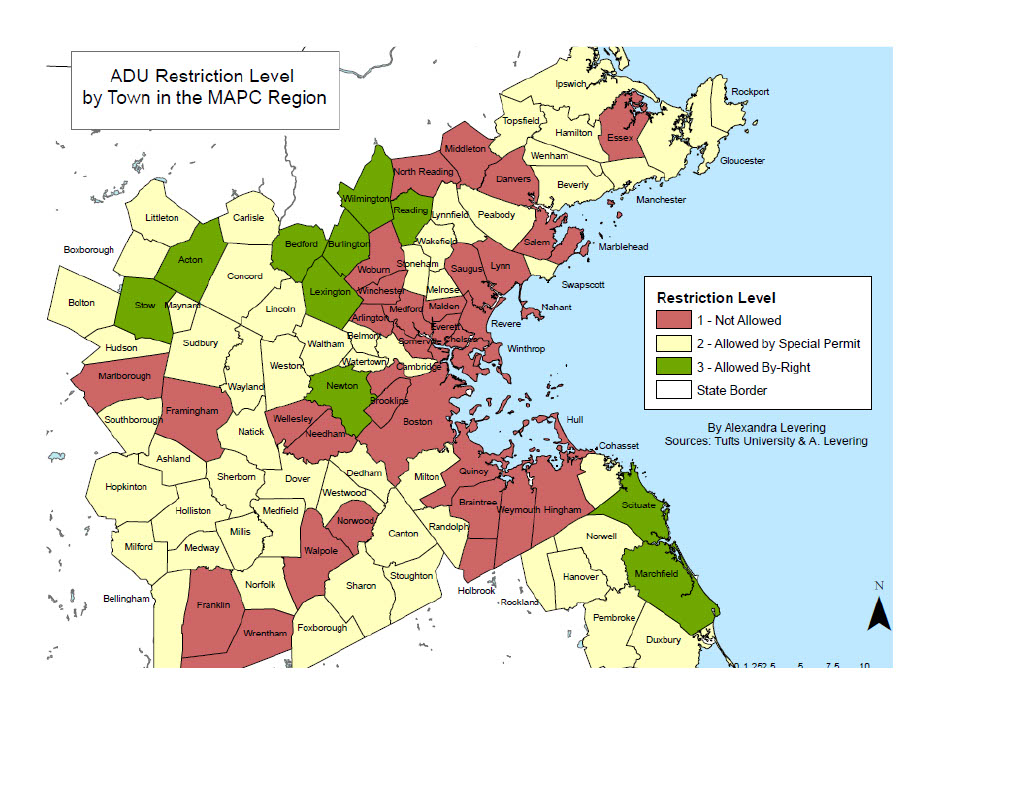
According to a study (https://equitable-arlington.org/2020/02/16/accessory-dwelling-units-policies/), by 2017 65 out of 101 municipalities in the greater Boston (MAPC) region allowed Accessory Dwelling Units by right or by special permit. The average number of ADU’s added per year was only about 3. But by 2017, Lexington had 75 ADUs and Newton had 73. Both of these communities were among about 10 “as of right” municipalities in the MAPC region. This finding suggests that communities with more restrictions are less likely to see any significant affordable housing benefits.
Even in the midst of a housing crisis in this region, according to Amy Dain, housing expert, (https://equitable-arlington.org/2020/02/18/zoning-for-accessory-dwelling-units/) most municipalities still have zoning laws that restrict single family home owners from creating more affordable housing.
And this is despite the fact that, as according to Banker & Tradesman, March 10, 2020: https://www.bankerandtradesman.com/63-percent-in-greater-boston-back-adus/, 63% of people in the region approve of ADUs. California has recently passed strong pro-ADU legislation. A study by Zillow further corroborated this strong interest in communities across the US, including our region. https://equitable-arlington.org/2020/03/10/adu-popularity/.
Learn more about Accessory Dwelling Units/ “Granny Flats” here: https://planning.org/knowledgebase/accessorydwellings/


Prepared by: Barbara Thornton with the capable assistance of Alex Bagnall, Pamela Hallett, Patrick Hanlon, Karen Kelleher, Steve Revilak and Jennifer Susse.
As Arlington considers new zoning and other policy decisions to increase the amount of affordable housing in the town, a concern has been raised about the threat of greater costs to the Town’s budget from new people with school age children moving into the town. The concern: additional children in the public schools costs the town more than the additional new property tax revenue the Town collects from the new housing.
This post examines this concern, drawing on data from two recent housing developments, representing 283 units of housing in Arlington, to determine that actually the Town budget gains over 4.5 times the actual cost of paying for the students. According to the most recent 2020 tax bills, the Town expects to collect $1,250,370 in revenue and to spend an additional $269,589 for the new Arlington Public School students living in these developments.
The data suggests that the fear of increased school costs, overwhelming the potential new revenue from new housing construction is not warranted.
For more information, see the full post here.