In 2015 Town Meeting approved the Master Plan. Following is the Housing chapter of that plan. It contains a great deal of information about details of the housing situation in Arlington, challenges of housing price increases, needs for specialty housing, opportunities for meeting these needs, etc. The authors found that “most cities and towns around Arlington experienced a significant rise in housing values from 2000 to 2010. A 40 percent increase in the median value was fairly common. However, Arlington experienced more dramatic growth in housing values than any community in the immediate area, except Somerville. In fact, Arlington’s home values almost doubled.” This and related data helps explain why the need for affordable housing is now so acute.
Related articles
Welcome to the redesigned Equitable Arlington website! We know that Arlington values openness and diversity, a greener future, and vibrant neighborhoods and downtowns—but our current zoning is holding us back. We’re advocating for change because we recognize that the choices we make on zoning and housing policy are key to living those values. We are committed to strengthening our community through respectful dialogue and by listening to our neighbors. Our aim with this site redesign is to share accurate and relevant information to help inform such conversations.
With this redesigned site we have:
- Answered some of the most common questions that have come up in our conversations with other residents.
- Created a zoning dictionary with explanations of many of the terms that pepper zoning discussions.
- Gathered a list of resources, where you’ll find everything from short explainer videos to detailed research
- Developed a history of zoning timeline that shows how Arlington’s history fits into the larger context of government actions.
If you’re not familiar with us, I hope you’ll take a minute to read our mission and why our work matters. I also hope you’ll scroll through to meet us, see some of our smiling faces, and read in our own words why we do this work. We’re renters and homeowners, long time residents and newcomers to town who come to this work with a variety of viewpoints and lived experiences!
We believe Arlington can be a leader in the greater Boston area by the choices we make to create more equitable housing policy. Our local actions have effects that go beyond our borders. Arlington has recognized our power to make an impact and has been a regional leader on many issues.
We can channel this same energy and our values to make sure Arlington has the vibrant sustainable and equitable future we all want. To succeed, we need engaged residents who understand the issues, who can balance competing interests, and who are willing to do the necessary hard work. Please join us in building a more equitable Arlington!
(DRAFT – 7/11/2019)
Overview
Arlington Planning Department officials report on options for the Town to mitigate the effects of housing demolitions and housing replacements in neighborhoods.
Evidence suggests that lack of appropriate regulatory policies have led to incidences of “mcmansions” and other issues that concern neighborhood residents. This study looks at the data, the policy and regulatory options for Arlington. It also looks at how comparable nearby communities have managed similar circumstances.
This 42 page report covers a great deal of data and analysis of homes by zoning district, gaps in the effectiveness of the current regulatory structure, affects on affordability in Arlington by zoning district, information on housing prices and sales, etc.
“Best practices” include descriptions of demolition delay, expansion of local historic districts, neighborhood conservation districts, design review standards and guidelines and possible revisions to the regulatory framework in Arlington. The report also includes interesting case examples of how comparable communities near Arlington handle these issues.
This report was presented to the Arlington Select Board on July 22.
Read the complete report and see the available data and tables.

(by Steve Revilak)
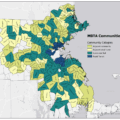
In 2021 the Massachusetts State Legislature passed the MBTA Communities act, which requires cities and towns served by the MBTA (aka “MBTA Communities”) to create districts where multi-family housing can be built by-right, without a disretionary approval process. The law was intended to help address the Commonwealth’s housing shortage, and to encourage more transit-oriented development. Building housing near transit and walkable areas has a lot of environmental benefits; it let’s people take trips without driving, lessens congestions, and cuts down on greenhouse gas emissions. It’s a solid strategey.
Arlington created its multi-family districts in the fall of 2023 and the Attorney General’s office approved them in June 2024. The laws have been on the books for just over a year — what kind of a difference are they making in Arlington?
2024 was a slow year for the MBTA Communities act in Arlington; there was one application which turned a two-family home on Belknap St into a pair of two-family homes, for a net change of two additional dwellings. 2025 has brought more activity. There are four applications under the review by the Arlington Redevelopment Board but none have been approved yet. These are:
- 225 Broadway, to convert a two-family home into a four-family,
- 126 Broadway, to convert a two-family home into a mixed use building with space for a business on the first floor, and 14 apartments,
- 18 Grafton, to convert a one-family home into a four-family, and
- 9-11 Robbins Road to convert a two-family home to nine apartments
There was an additional application to convert four apartments to five at 259 Broadway, but the applicant withdrew after their first hearing.
If all of these projects are approved, the net change will be an additional 26 homes, which represents a 0.1% increase relative to the 20,460 dwellings that Arlington had as of the 2020 census. It’s been a very slow trickle.
The MBTA Communities act was a meaningful reform which is just starting to make a difference. It’s bringing proposals for smaller multi-family homes that used to be the mainstay of our housing stock, but are generally rare today. However, the MBTA Communities Act is only one tool and Massachusetts will have to do more in order to build the 222,000 homes we need.
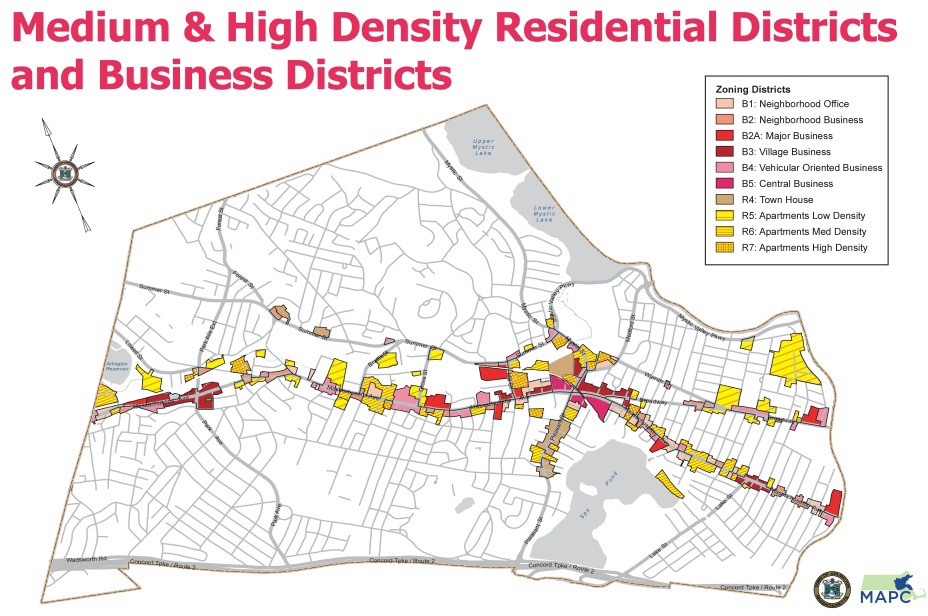
The discussions on zoning have been confusing because while zoning covers ALL of Arlington’s land and the zoning bylaws for all Arlington’s zones are referenced, the key issues of greatest interest to Town Meeting are the discussions about increasing density. These discussions pertain ONLY to those properties currently zoned as R4-R7 and the B (Business) districts. These density related changes would affect only about 7% of Arlington’s land area. The map shows the specific zones that would potentially be affected. They lay along major transportation corridors.