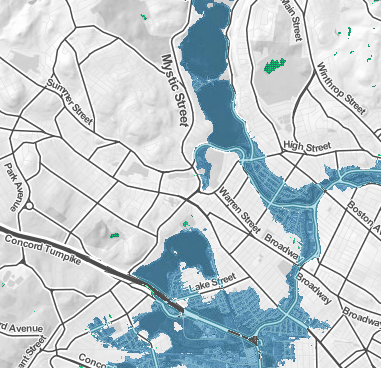
Climate Central’s Surging Seas global Risk Zone Map provides the ability to explore inundation risk up to 30 meters across the world’s coastlines as well as local sea level rise projections at over 1,000 tide gauges on 6 continents.
Set the map for Boston MA and focus in on the Arlington area to see how the town would be affected by rising sea levels, as predicted over the next few decades.
Map areas below the selected water level are displayed as satellite imagery shaded in blue indicating vulnerability to flooding from combined sea level rise, storm surge, and tides, or to permanent submergence by long-term sea level rise. Map areas above the selected water level are shown in map style using white and pale grays. The map is searchable by city, state, postal code, and other location names. The map is embeddable, and users can customize and download map screenshots using the camera icon in the top right of the screen.
For map areas in the U.S., the Risk Zone map incorporates the latest, high-resolution, high-accuracy lidar elevation data supplied by NOAA, displays points of interest, and contains layers displaying social vulnerability and population density. For map areas outside the U.S. the map utilizes elevation data from NASA’s Shuttle Radar Topography Mission (SRTM).