Related articles
A new report for Boston Indicators, “Exclusionary by Design”, shows the clear intent of many Greater Boston suburbs to resist racial and class integration in the 1970s. Housing scholar Amy Dain demonstrates how racial prejudice and class exclusion figured into suburbs’ downzoning in the 1970s; and how putatively legitimate concerns like tax revenue, aesthetic continuity, and the environment served the cause of exclusion.
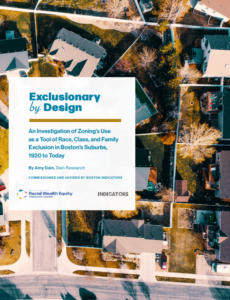
Read the “Exclusionary by Design” report, and see the accompanying 1-hour webinar with Amy Dain, Luc Shuster of Boston Indicators and Ted Landsmark of Northeastern University.
“This research finds widespread evidence that over the past 100 years, zoning has been used by cities and towns across Greater Boston as a tool for excluding certain groups of people, including:
- Racial minorities, especially Black residents
- Lower-income and working-class residents
- Families with school-aged children• Religious minorities
- Immigrants
- And, in some cases, any newcomers/outsiders at all”
Low Diversity is No Accident
In the 1970s, municipalities were ordered by state law to create Growth Policy Statements – but with no mandate that communities actually endorse growth nor inclusion. Exclusionary language in these statements was seemingly anodyne, seeking to preserve the “present characteristics of their communities” or “socio-economic status“. In several cases the fear of integration was quite apparent: Milton’s statement referred to problems in “surrounding communities” (ie Mattapan and Dorchester) and “breakdown of society”; both Milton and Melrose make mention of the pressures caused by people “moving out of Boston”. Belmont’s plan explicitly calls for the town to stay “relatively expensive … [so as to] attract only those families so economically situated.”
The intent of such language was not somehow lost on people in that era. Needham’s Local Growth Policy Statement included, but pointedly disavowed its own “Appendix A” — a dissenting statement by the Congregational Church of Needham, calling out the town’s exclusionary aims and endorsing a vision of inclusive growth.
In addition, in many places where multi-family housing was theoretically allowed, “poison pill” requirements and impediments were added to make such building a practical impossibility. More recently we have seen the ironic use of infeasible “inclusionary zoning” requirements – which ensure that no affordable housing can actually be built.
The same language, un-evolved and unrefined, is still invoked by “neighborhood defenders” today. Our current housing affordability crisis and segregation is the plain result. The report is a sobering, enlightening read – essential for any active citizen or town official in eastern Massachusetts.
from Karen Kelleher, Reporter
Interested in new policy developments on housing production in the Greater Boston area? The latest research from Mass Housing Partnership (MHP) is of interest. They just released (Dec. 18, 2019) in interactive map showing relative housing density around every mass transit and commuter rail station in the system, concluding that the region could add 235,000 units if every community allowed density as of right in the area around transit.
CHAPA has legislation pending that would require municipalities served by transit to allow higher density as of right within a certain distance from transit stations. You’ll see that the density around Alewife is not too bad in the context of the entire system.
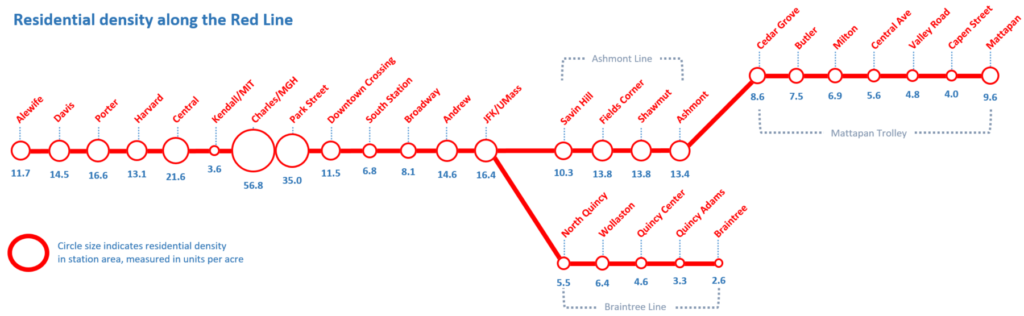
This is mostly because of very high density in Cambridge near Alewife, but the density of two and three families in East Arlington shows better housing density than the sea of single family zoning around many commuter rail stops.
You can check it out here:https://www.mhp.net/news/2019/todex-research-brief


by Andy Greenspon
Image credit: Henry Hudson Kitson, Public domain, via Wikimedia Commons
In 2023, Lexington was one of the first towns to comply with the State “MBTA Communities” law (MBTA-C) by adding 227 acres to several multifamily overlay zones. When discussing this proposal, it was estimated to possibly generate 400-800 units in 4-10 years. However, after receiving building permit applications for about 1,100 units in the first year (including 160 inclusionary affordable units), Lexington passed Article 2 at a Special Town Meeting recently, which decreased the amount of land in these zones to approximately 90 acres. What can Arlington learn from Lexington’s experience?
Overall, Lexington’s experience shows us that developers are willing and able to build multifamily housing on large lots that aren’t very built up, and that MBTA-C can be successful in adding new housing in some circumstances. However, Arlington has few if any large, sparsely-built parcels zoned to allow multifamily housing under MBTA-C. As such, Arlington is unlikely to add significant amounts of new housing or affordable housing as a result of the MBTA-C overlay passed at Town Meeting in fall of 2023.
Parcel Size and Existing Buildings
Many of the parcels in Lexington’s MBTA-C zone are multiple acres each, are underutilized, and contain older office space. In contrast, Arlington’s MBTA-C parcels are much smaller and mostly covered with existing buildings, typically residential.
The largest development approved under MBTA-C so far in Lexington is at 3-5 Militia Drive. This land is three very large parcels containing a couple older office buildings, a previous religious institution, and giant surface parking lots. Therefore, such a property was already primed for redevelopment and the large lots allowed for 292 units to be approved. These parcels are also within walking distance of Lexington Town Center and the Minuteman Bike path, so multi-family housing on this location is a great use.
In contrast, there are no similar parcels in Arlington in the MBTA-C zone with large surface parking lots and aged office space that could be redeveloped in such a manner. One of the few parcels in Arlington that is somewhat similar to the planned parcels for redevelopment in Lexington would be the Walgreens at 324 Massachusetts Ave, 1.5 acres with a surface parking lot. However, this parcel was specifically excluded from the MBTA-C overlay along with all other business parcels to avoid displacing any existing business space. And the parcel is unlikely to be redeveloped one way or another unless Walgreens chooses to close their business and sell the parcel to a developer.
In short, compared to Lexington, Arlington is “built out” insofar as almost every parcel is utilized in some manner with high lot coverage. The original Lexington MBTA-C zone contained many parcels with low lot coverage, large surface parking lots, and underutilized office space, all attributes that make such parcels more likely to be sold to a developer to construct housing if permitted by zoning.
Last, while 1,100 units have been permitted so far, this does not mean all these units will be constructed given current financial uncertainty in the economy and high interest rates. It will also take several years for these properties to be completed and prepared for occupancy. As such, the original estimate of 400-800 units in 4-10 years (an estimate that actually widely ranges from 40 units all the way to 200 units per year) may in fact not be that far off from the final numbers once buildings are completed. The parcels most primed for redevelopment were acquired and permitted first. Finally, it is not entirely clear how many more parcels would have been redeveloped in the next 5-10 years had the Lexington MBTA-C zoning not been reduced in size.
Development Potential in Arlington
Most privately owned lots in Arlington are less than ⅓ of an acre with many much smaller, significantly limiting the amount of new housing development on any single parcel. Almost all of these lots are covered by existing buildings, and some of those buildings are condominiums. Therefore, in order for a large new construction project to occur on such parcels in Arlington’s MBTA-C multifamily zone, all of the following would have to take place:
- a single owner would have to take control of multiple lots and/or condominiums, meaning that
- multiple existing property owners would have to want to sell at the same time, or else the new owner would have to take the time and risk to assemble the property slowly, and
- the new proposed development would have to be large and profitable enough to make up for the combined purchase prices of all the properties acquired.
Meanwhile, properties in Arlington generally turn over at a fairly slow and steady pace. This is in contrast to underused large commercial properties, whose owners are more eager to sell.
With simulation modeling performed on potential rate of redevelopment, the Arlington Redevelopment Board’s 2023 Report to Town Meeting on the MBTA-C proposal projected that 15–45 parcels could be redeveloped over the next ten years, for a net increase of 50–200 new units or 5–20 per year, far fewer than even the initial Lexington housing unit construction estimates at the time of passage of their initial MBTA-C zoning.
In fact, Arlington has seen even less than the low end estimate of 5 units per year so far since our MBTA-C zoning became effective. Only a single project has been permitted so far, which would turn an existing 2-unit building into 4 units, a potential net gain of 2 housing units.
Lessons
- There is strong regional demand for housing including for multifamily units.
- Developers are currently willing and able to build when lots are available, are zoned multifamily, and aren’t already full of other buildings.
- Arlington can’t expect anywhere near as many new units with our current zoning as Lexington saw, because our MBTA-C multifamily zones are almost exclusively made up of smaller and built-up lots.
- As a result, Arlington’s current zoning won’t add much housing or affordable housing to our community, and won’t noticeably increase our tax base either.